Distance Mode Graphed Data
In order to produce a graph, a comparison must take place. When we previously graphed the GPS_MPH
channel, the data was compared to time, which began at logging start and ended at power down of the
G2X. At this time, graph the GPS_MPH, GPS_LatG’s and GPS_Gs from your currently open lap.
Since we now have a track map in place, the data will be graphed compared to time from the start /
finish line. The time into the lap, according to the position of the mouse cursor in the Main Graph area,
is provided by the Cursor Position Box
. In certain applications, it is often more useful to
compare the data to distance from the start / finish line.
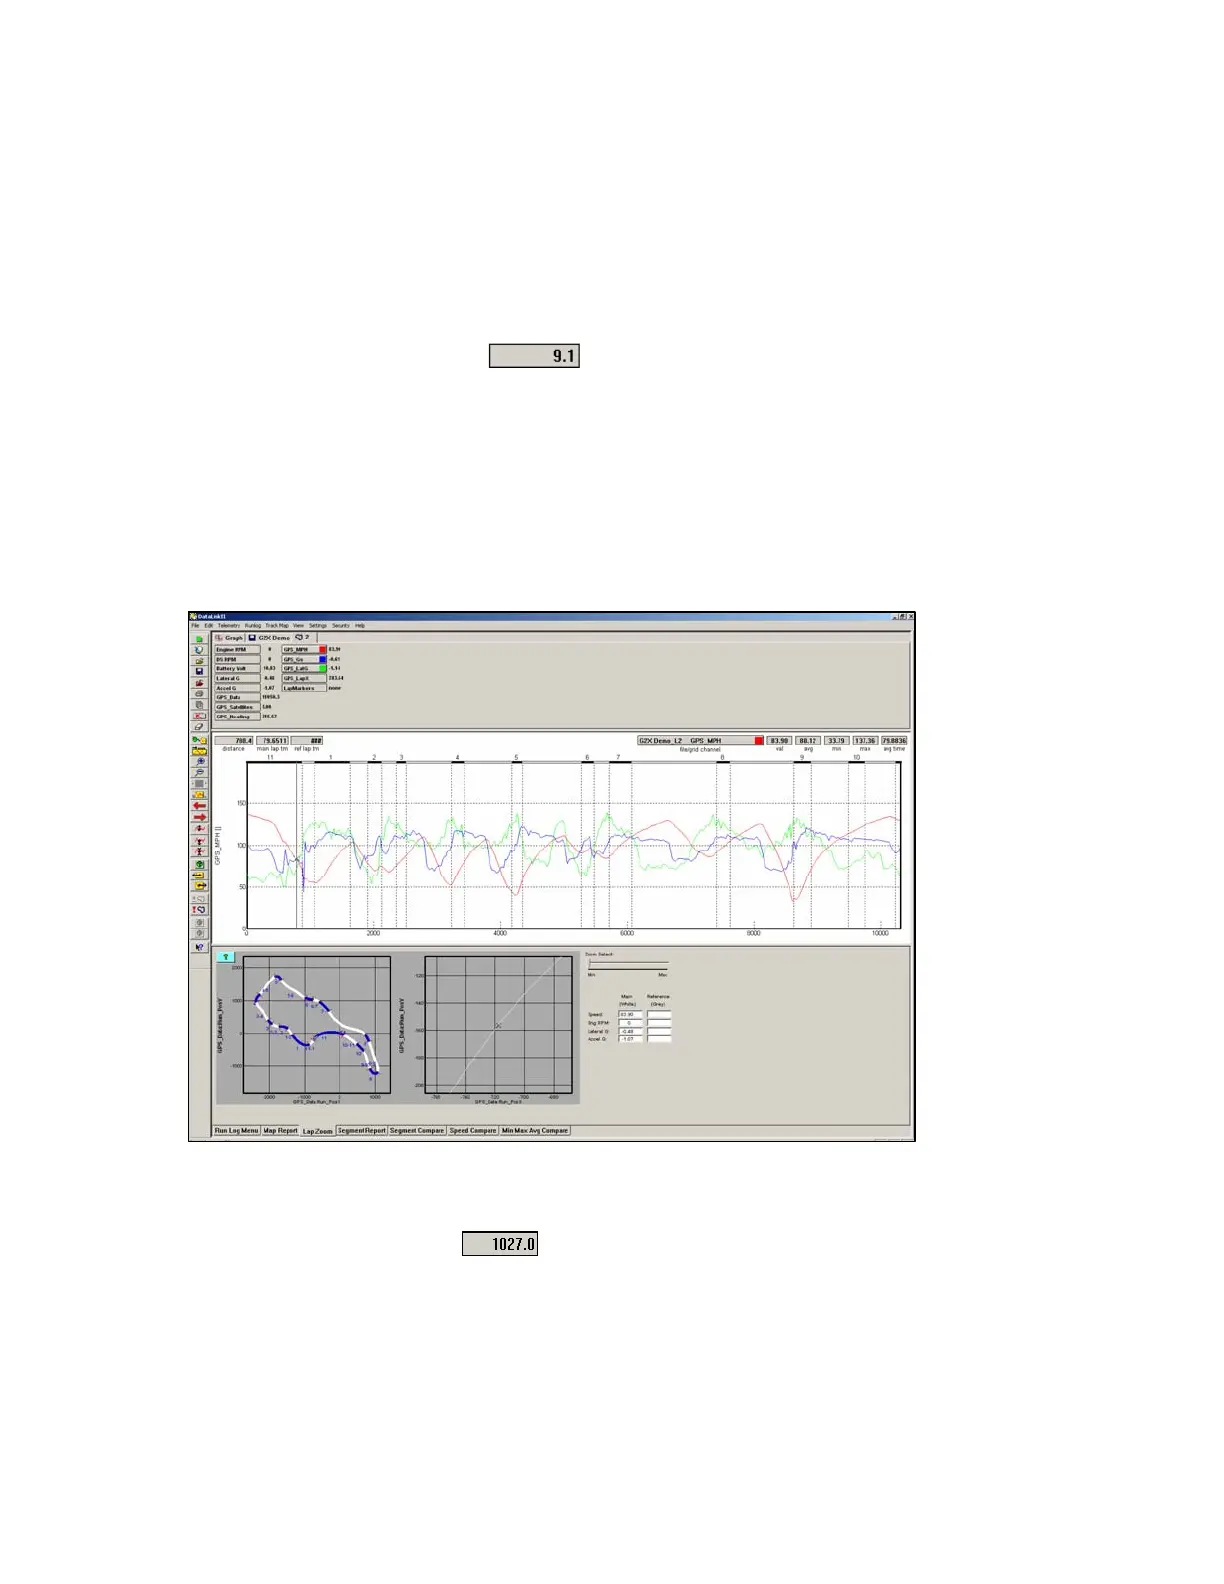
To place the Main Graph area in distance mode, select View in the DataLink main menu selection and
then select the Segment X Mode option.
You will note the numbers along the bottom of the graph now display distance (feet) around the track
and the top of the graph is now broken into track segments as defined by the track map. Track map
segments provide a quick view of vehicle location, as defined by the track map.
Your screen should appear as shown above.
In addition the Cursor Position Box
located in the upper left hand corner of the Main Graph
area now displays the cursor position in feet into the lap rather than time.
61