Graphing Data from an Entire Run
There are occasions when it is necessary to review all of the data created during one test outing on the
track (Runfile). Data from a Runfile may be graphed the same as data from a Lapfile.
Often times, changes that occur are often easier to detect when reviewing the entire Runfile, as opposed
to reviewing only one lap of information.
To graph Runfile data:
Double click the Clear all Graphs icon
in order to remove all graphed data from the Main Graph
area.
Left click over the desired Runfile tab.
Graphed the desired channel.
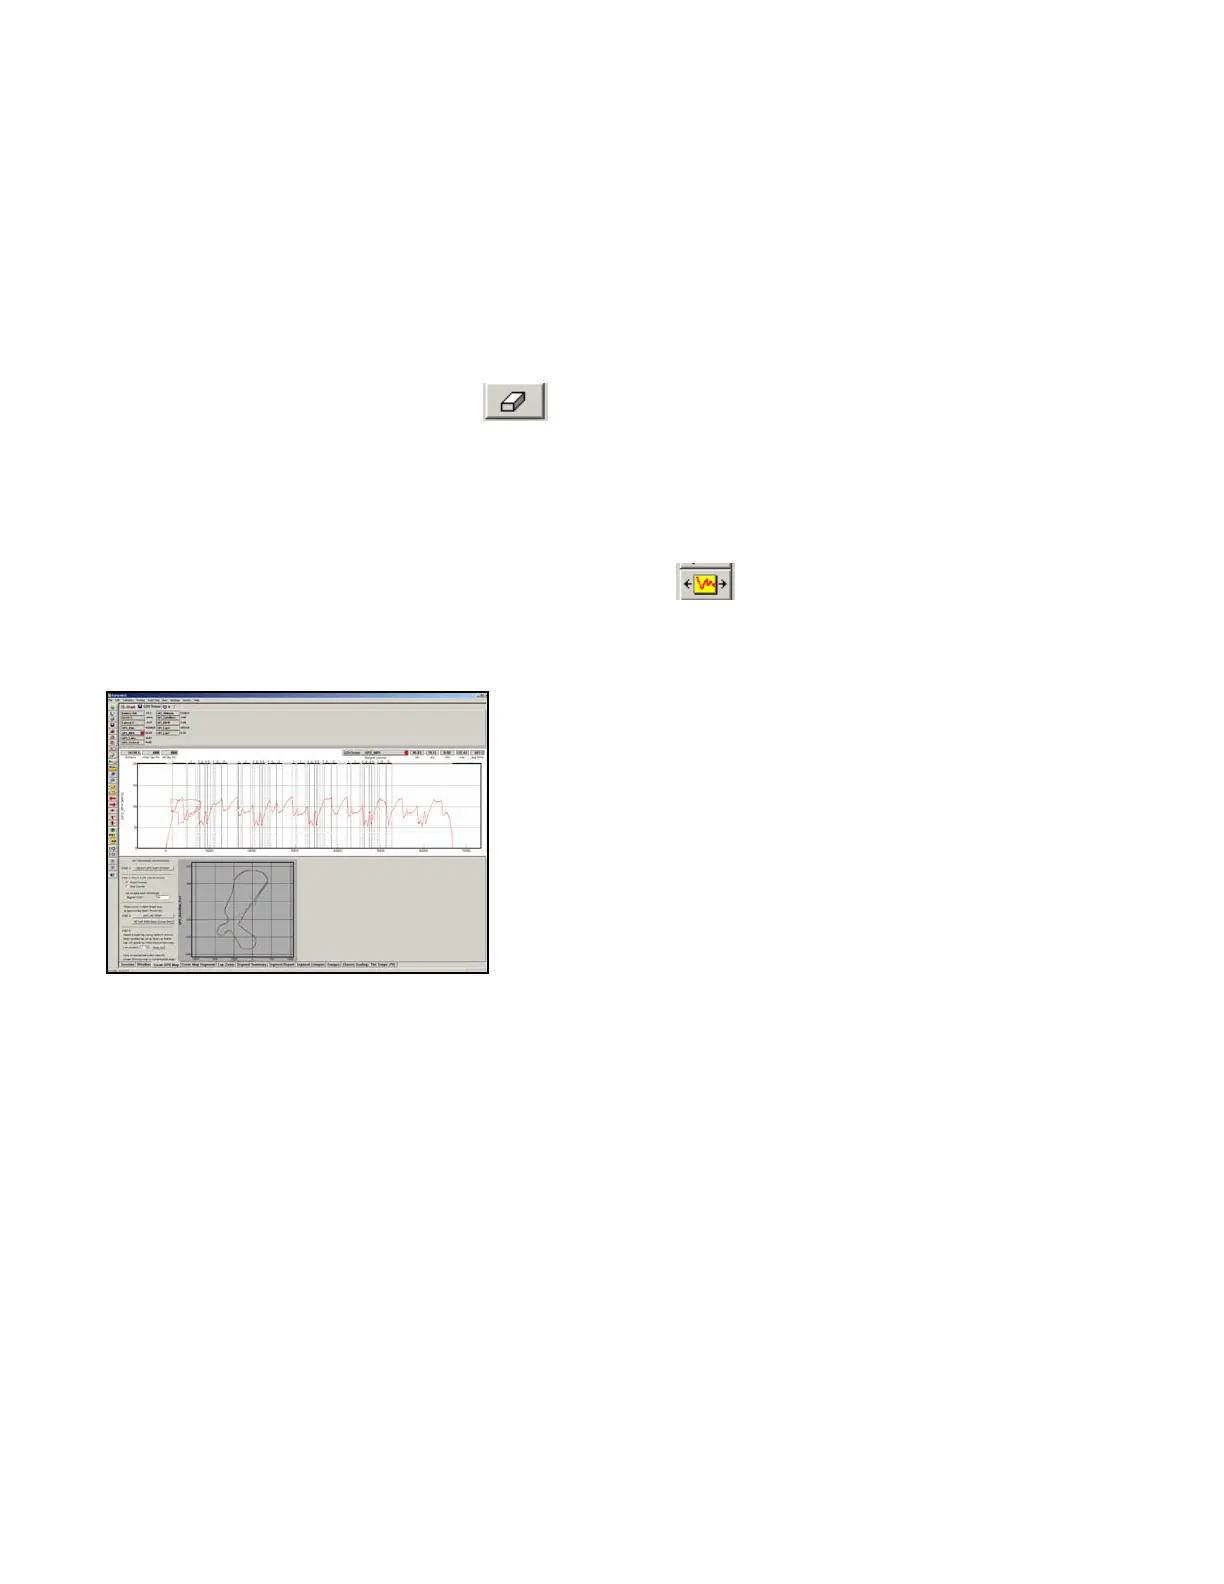
Left click the Autoscale icon, located in DataLink icon list
The screen should appear as below.
As can be seen, the entire GPS_MPH, from start of logging until end of logging, can now be reviewed.
Zoom Command
The Main Graph area as previously described displays an entire lap on the display screen. In many
instances you may wish to zoom in on a particular area for a detailed analysis. Two methods are
available.
The first method is to create a zoom box using the right mouse button. To do so:
Determine the desired zoom area of the Main Graph.
Place the mouse cursor in the upper right corner of the desired zoom area.
Hold down the right mouse button and drag the zoom box over the desired zoom area. Release the right
mouse button.
72