Time / distance or data channel scaling is zoomed according to what portion of the graph is included in
the zoom box.
The second method is as follows:
Place the mouse cursor at the center of the graph region to be zoomed.
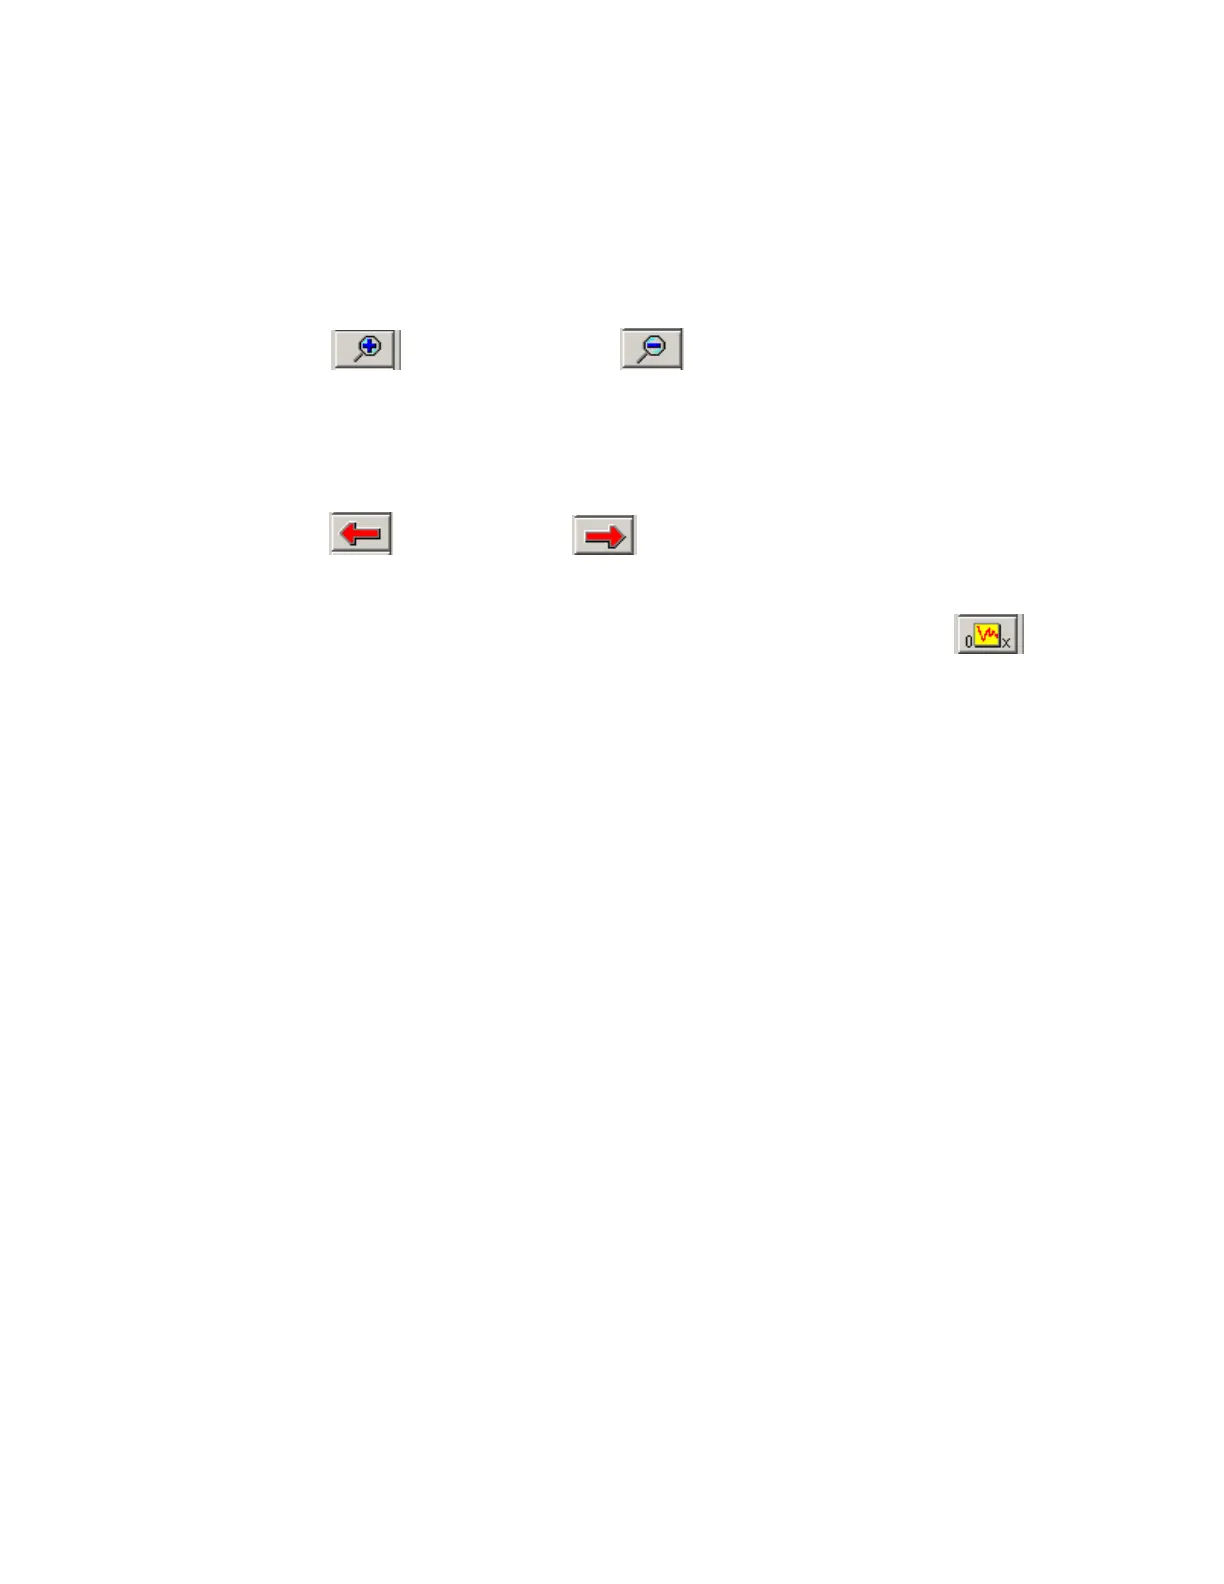
Left click the Zoom In
icon or the Zoom Out icon in the vertical toolbar. The graph
region will zoom in or out accordingly.
Once you have zoomed in on a section of data, you may also want to shift either to the left or right to
view additional data without changing the current zoom settings.
Click on the Shift Left
or the Shift Right icon in the RacePak Chart data toolbar to move
the displayed graph region left or right.
To reset the main Graph region back to displaying an entire lap, click on the User Scale button in
the RacePak Chart data toolbar.
73
 Loading...