30
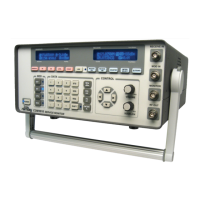
BASIC OPERATION
2.12 Zooming the Frequency Meters
Each Frequency meter has a corresponding display in the Zoom Meter Mode. The only excep-
tion is the +/-4 kHz Deviation Bargraph Meter. The +/-6 kHz Deviation Bargraph Meter is dis-
played twice in the Zoom Meter Mode list.
To Zoom the display, press METER SELECT, then SHIFT, . . Once zoomed, you can continue to
press METER SELECT to select other meters, or use the power meter by pressing SHIFT, 3.
Example:
In the modulation meter above, each large tick represents 1 kHz, so the meter is reading –
3.2/+3.5 kHz of deviation. If you want numbers instead switch to the text version of this me-
ter by pressing METER SELECT a few times.
Example of the two meters displayed during zoom deviation text meter. The left meter is the
signal level RSSI bargraph (currently reading –92dBm), and the deviation meter on the right.
Example of the frequency error bargraph. This auto-scaling bargraph is for visual tuning, but
you can derive the actual error using the tick marks and the current scaler value on the left
display. The scaler is a 10
X
multiplier, so for example the above display is scaled as 10
2
or
100Hz for each tick.
Depending on how different the receive frequency is from the counter frequency will be how
large the scaler is and how far to either side. To quickly get the actual count value, use METER
SELECT to switch to the text version of the error meter.
GENERATE TX Level
Modulation Seq/Reg
RECEIVE Level Meters
Counter Freq Meters
RECEIVE Level Meters
Counter Freq Meters
GENERATE TX Level
Modulation Seq/Reg
GENERATE TX Level
Modulation Seq/Reg
RECEIVE Level Meters
Counter Freq Meters
Property of Ramsey Electronics, Inc.
Do not reproduce or distribute.