Viewing Recorded Files
Viewing Options
Uploaded data can be viewed on the screen, printed, and
exported to other applications.
PAS offers you different options for easy analysis of retrieved
trend and fault data. Data can be displayed in primary or
secondary units. You can use filtering to find out and work with
a subset of events that meet the criteria you specify, or use
sorting to rearrange records in the desired order. PAS can link
events and the corresponding data records and waveforms
together to allow you more effective analysis of recorded
events.
For data log files, PAS allows you to view data trends in a
graphical form, measure the delta time and magnitude
between two trend points, calculate average and peak values
within time intervals.
For waveform files, PAS provides phasor diagrams,
symmetrical components and delta measurements, and can
show you a waveform as an RMS plot or as a spectrum chart.
For more information on viewing log files and available
options, see the “PAS Getting Started Guide”.
Viewing the Device Event Log
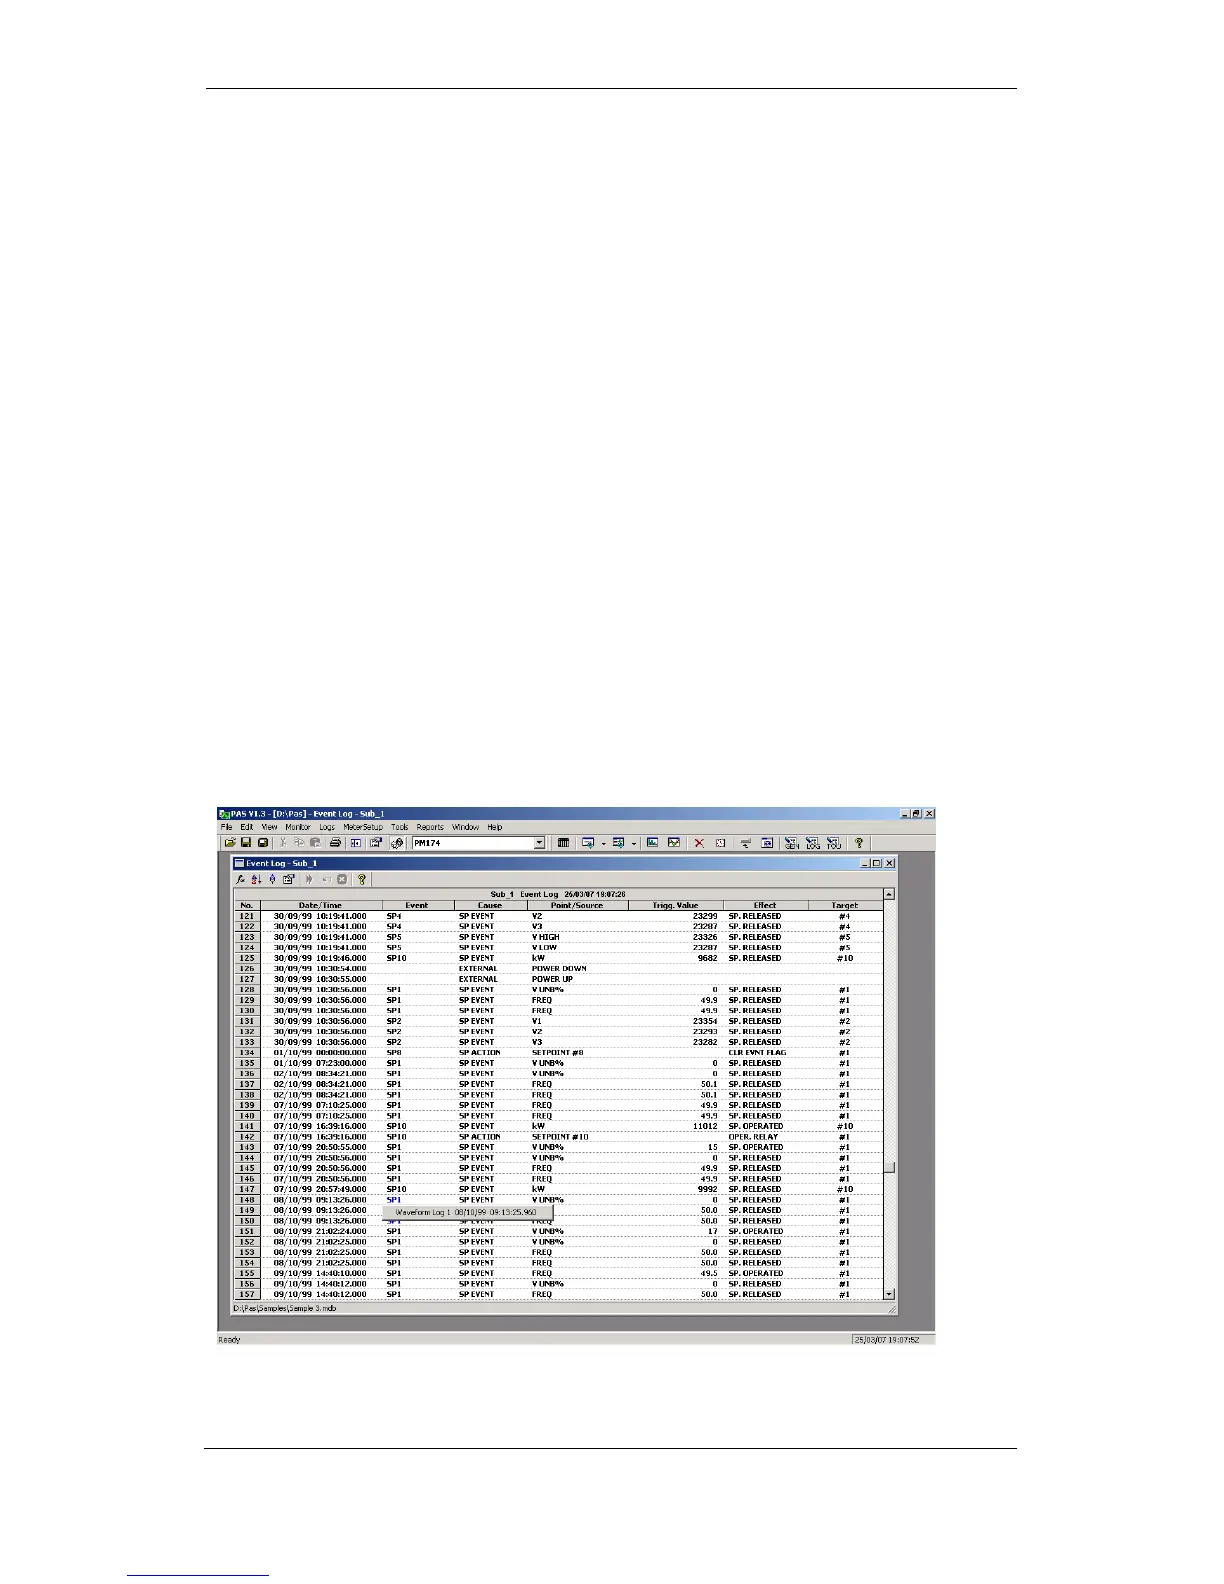
Event log files are displayed in a tabular view. PAS loads the
entire database table to a window, so that you can scroll
through the entire log to view its contents.

 Loading...