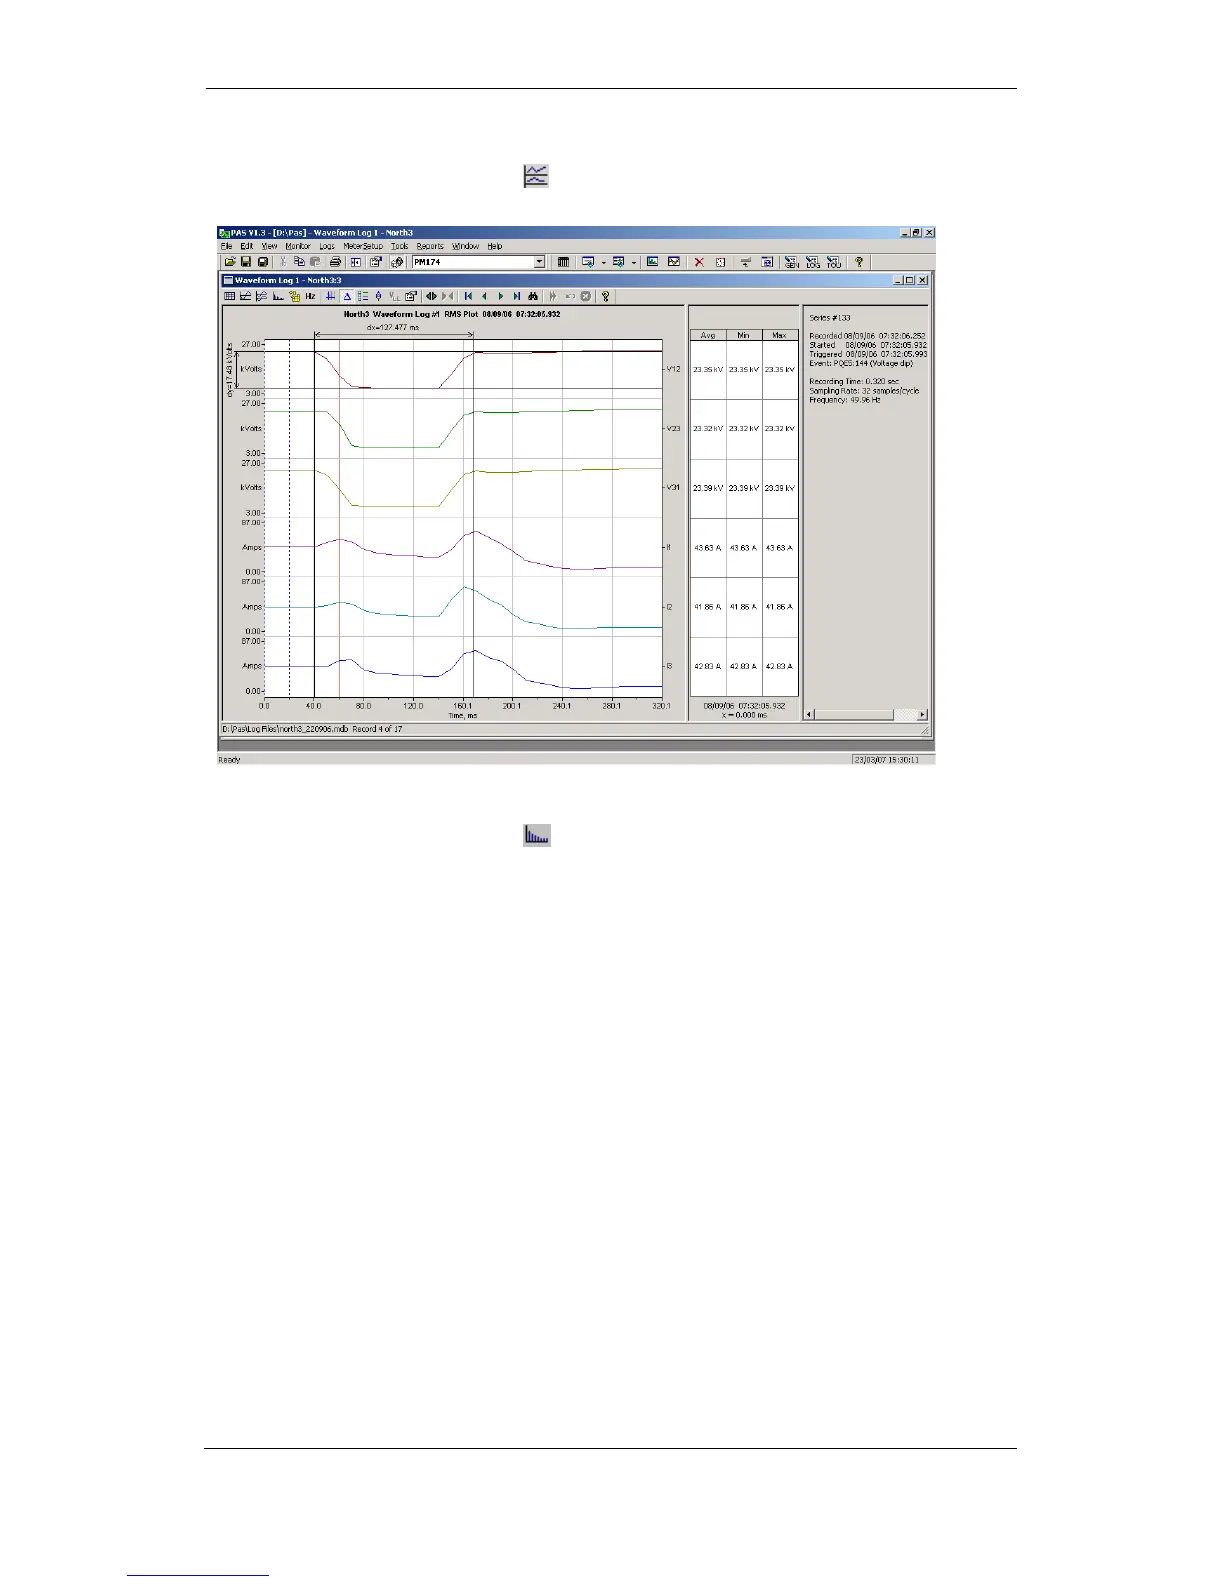
Viewing an RMS Plot
Click on the
button to open the RMS view. PAS shows you
a cycle-by-cycle RMS plot of the sampled AC waveforms.
Viewing a Spectrum Chart
Click on the
button to view a spectrum chart. To change a
channel, click on the window with the right mouse button,
select “Channels...”, check the channel you want displayed,
and then click OK.
A spectrum is calculated over four cycles of the waveform
beginning from the point where the left marker line is located.
If there are more than one waveform views open, PAS gives
the priority to the overlapped waveform view.