5
03.04 "Parameters" Operating Area
5.8 Dis
la
s
stem variables
5
Ó Siemens AG, 2004. All rights reserved
SINUMERIK 840D/840Di/810D Operator's Guide HMI Advanced (BAD) – 03.04 Edition 5-259
Manage
log
The button "Manage log" calls up a dialog box in which you can
· Save a new log to a file or
· Reselect a log that is already saved.
Graphic
log
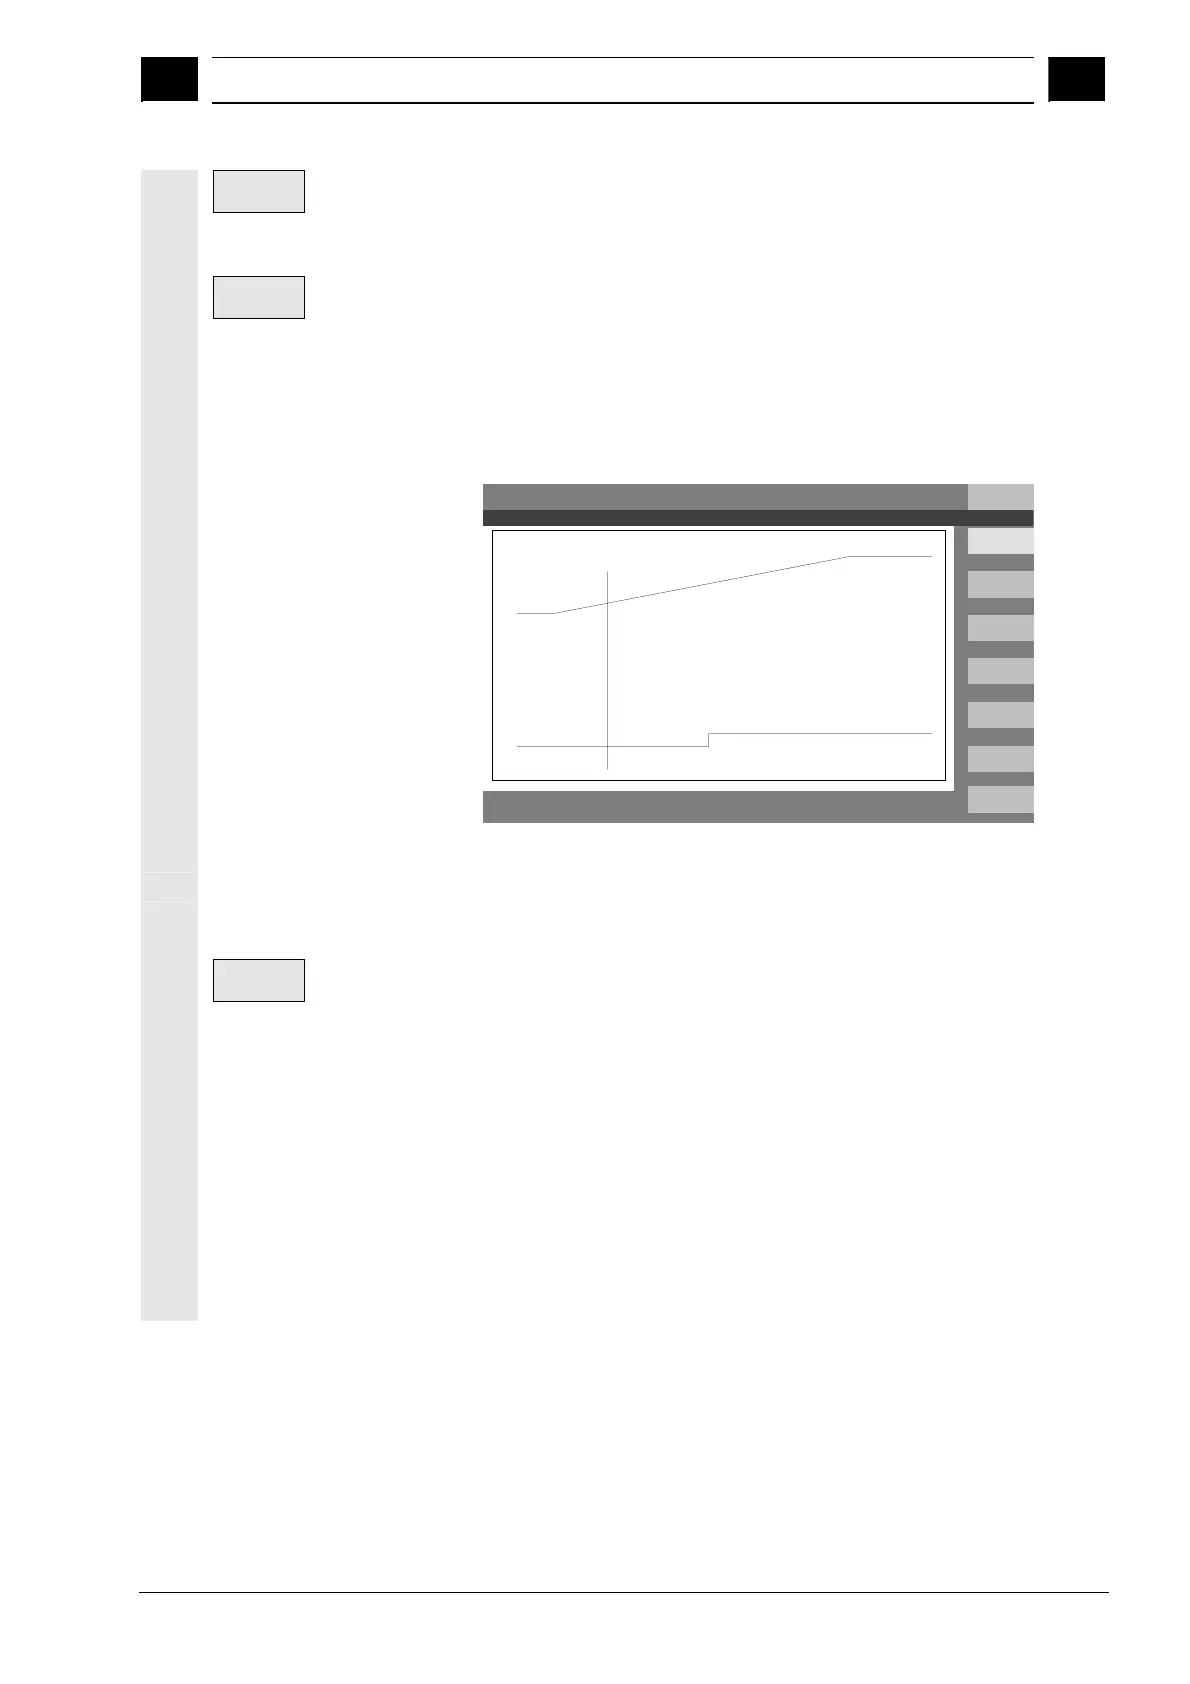
With the button "Graphic log" you call up a window in which the
changeover time of the variables is displayed as a curve.
Measuring times are output along the horizontal axis and
the variable contents along the vertical axis. A graphic log window
may contain several curves, the appropriate variable name is
displayed at the top left of each curve.
Graphic log
+ X 900.000 mm 0.000
+ Z 230.000 mm 0.000
Set
marker
<<
$AA_IW[1]=1002.000
t[ms]=2000
$A_OUT[3]=0
Set
marker
Display "Graphic log" provides you with a zoom function in which a
section that you have already selected can be expanded to cover the
entire display surface.
With the softkey "Set marker" a vertical cursor line appears which is
moved with the cursor left and cursor right keys.
The softkey text then changes from "Set marker" to "Set marker2" and
from "Set marker2" to "Expand".
Variable values marked by the cursor line are displayed on the left of
the display.
You do not need to normalize the display in any way, normalization
values are calculated automatically. The characteristic is automatically
normalized to values between minimum and maximum. Binary signals
are represented in expanded form.
n