Simrad ES60
84
857-160970 / Rev.H
Echo Trace
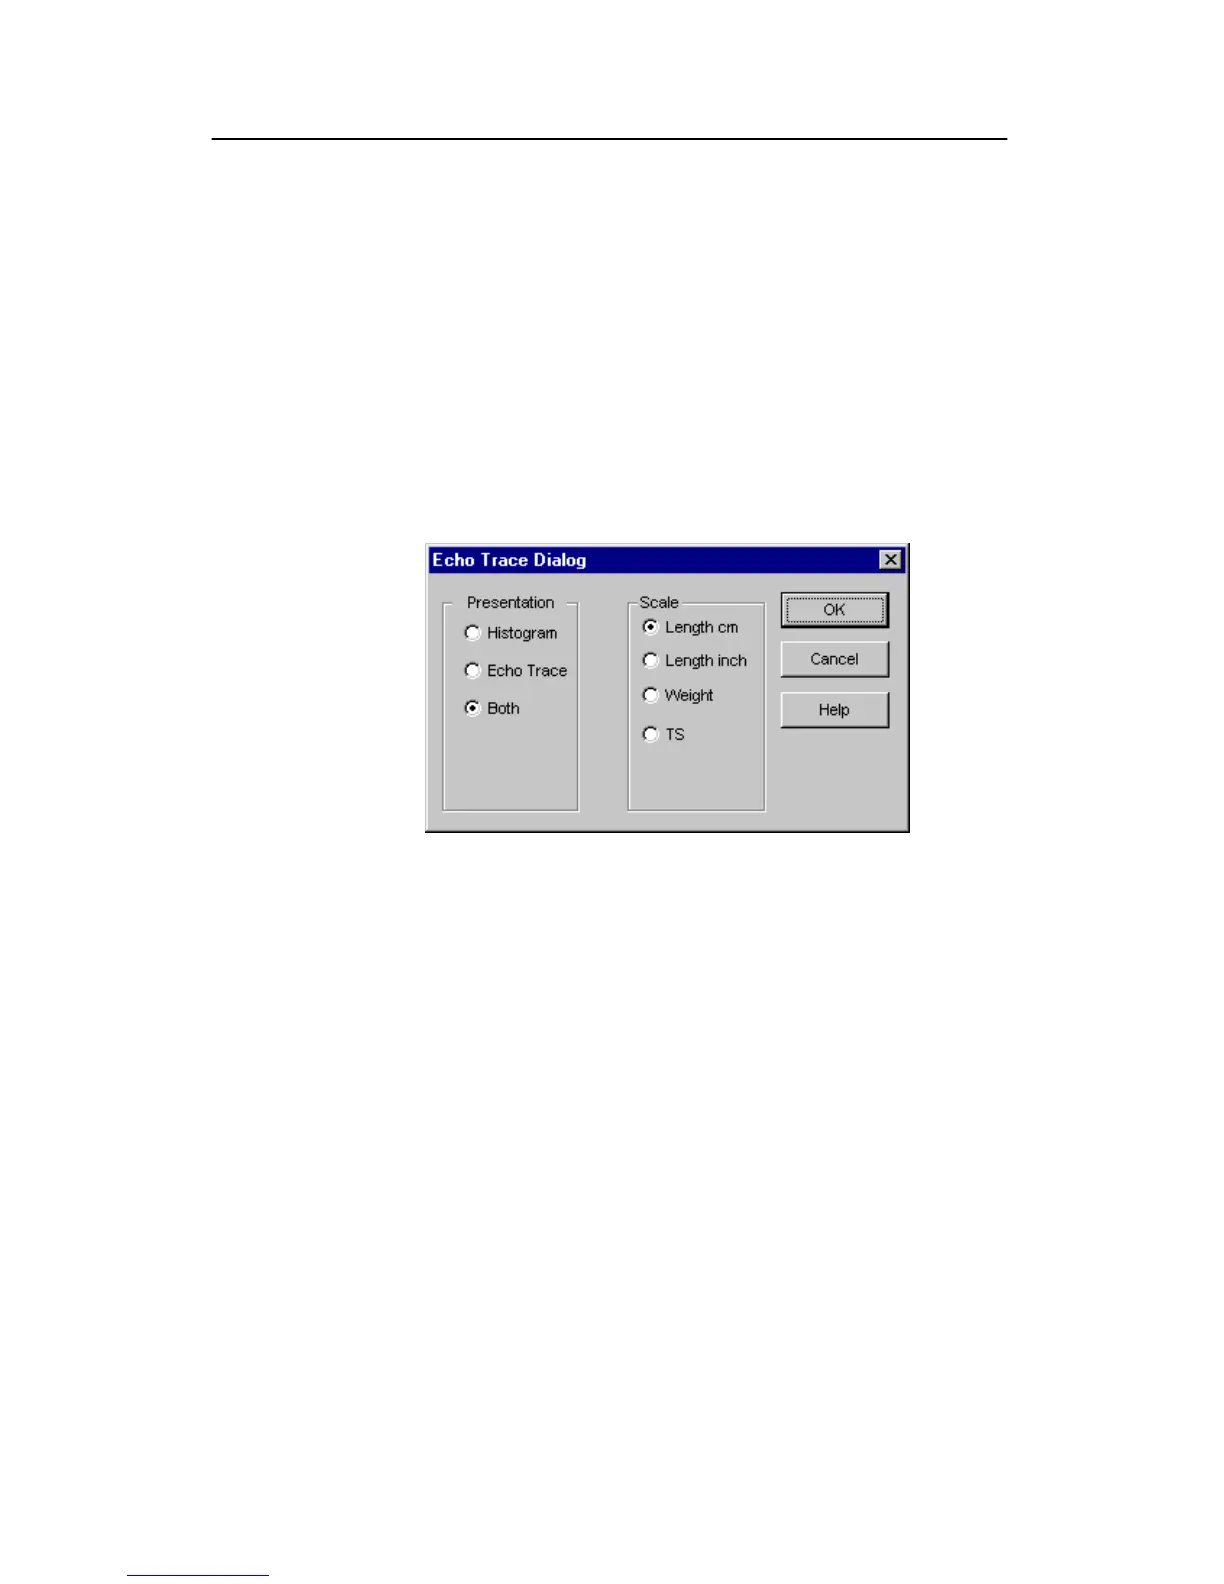
The Echo Trace dialogue box is opened if you right-click in the
Single Echo view on the display.
For each detection of a single fish the ES60 estimates the target
strength. Approximate formulas are used to convert target
strength to fish length and weight. Cod and other species with a
swim bladder are assumed. The statistical distribution of fish
size and the position of the fish inside the transducer beam are
plotted. These plots include fish detected within the vertical
depth range of the associated echogram. The size plot, the
position plot and the echogram use identical colour scale.
Presentation
Histogram - The frequency distribution of fish size is plotted;
12 size cells, 3 dB per cell. Total range plotted is 36 dB. Smaller
fish and larger fish are disregarded.
Echo trace - The position of the fish inside the transducer beam
is plotted. Only the three strongest detections are shown. A
circle shows the 6 dB beamwidth of the transducer.
Both - Fish size distribution and fish position are both plotted.
Scale
Length - The unit along the horizontal axis of the size
distribution histogram is fish length in centimeters or inches.
Weight - The unit along the horizontal axis of the size
distribution histogram is fish weight in kg.
TS - The unit along the horizontal axis of the size distribution
histogram is target strength in dB.