Chart overlay
You can add overlays on the chart panel.
When an overlay is selected, the chart menu expands to include basic menu options for the
selected overlay.
Information about the overlay menu options are described in more detail below or in their
separate sections in this manual.
Heat map overlay
The Heat map overlay feature shows a history of water temperature coloring on the chart. A
water temperature source is needed to provide the temperature data for the overlay.
The color range is adjusted automatically based on the minimum and maximum
temperatures recorded.
Transparency
Adjusts the transparency of the overlay. With a minimum transparency setting, the panel
details are almost hidden by the overlay.
Palette
Specifies the colors used to show water temperatures. A legend is shown on the panel that
identifies the colors associated with the recorded temperatures.
Clear history
Deletes all heat map data gathered up to the moment it is selected. Heat map data is
automatically deleted when the unit is turned off.
C-MAP charts
All possible menu options for C-MAP charts are described below. The features and menu
options available can vary depending on the charts you use. This section shows menus from
a C-MAP chart.
Ú
Note: A menu option is greyed out if the feature is not available on the chart displayed.
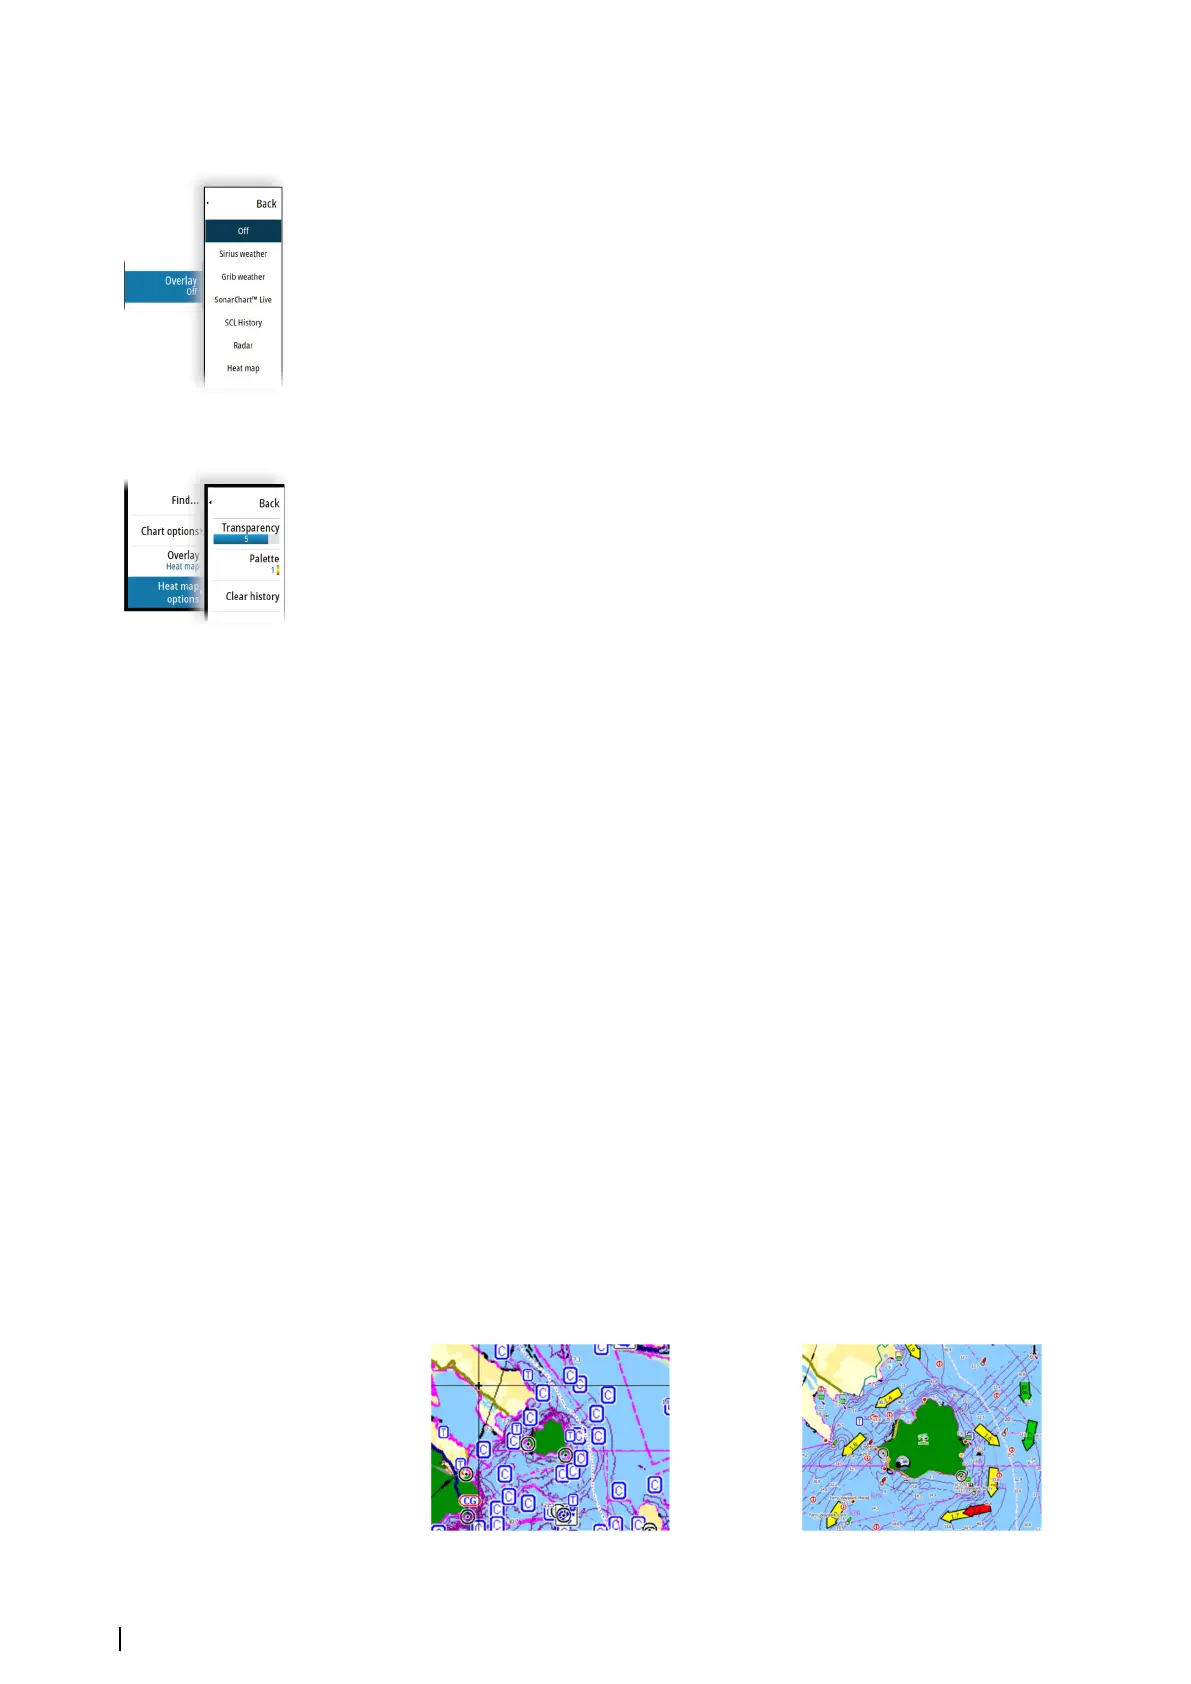
C-MAP tides and currents
The system can display C-MAP tides and currents. With this information it is possible to
predict the time, level, direction and strength of currents and tides. This is an important tool
when considering planning and navigation of a trip.
In large zoom ranges the tides and currents are displayed as a square icon including the
letter T (Tides) or C (Current). When you select one of the icons, tidal or current information
for that location are displayed.
Dynamic current data can be viewed by zooming inside a 1-nautical mile zoom range. At
that range, the Current icon changes to an animated dynamic icon that shows the speed and
direction of the current. Dynamic icons are colored in black (greater than 6 knots), red
(greater than 2 knots and less than or equal to 6 knots), yellow (greater than 1 knot and less
than or equal to 2 knots) or green (equal to or less than 1 knot), depending on the current in
that location.
If there is no current (0 knots) this will be shown as a white, square icon.
Static Current and Tide icons Dynamic Current icons
32
Charts | NSS evo3S Operator Manual