Chart details
Provides you with different levels of geographical layer information.
Easy View
Magnifying feature that increases the size of chart items and text.
Ú
Note: There is no indication on the chart showing that this feature is active.
Chart settings
The options in the chart settings dialog depends on which chart source is selected in the
system.
3D boat selection
Determines which icon to use on 3D charts.
Range rings
The range rings can be used to present the distance from your vessel to other panel objects.
The range scale is set automatically by the system to suit the panel scale.
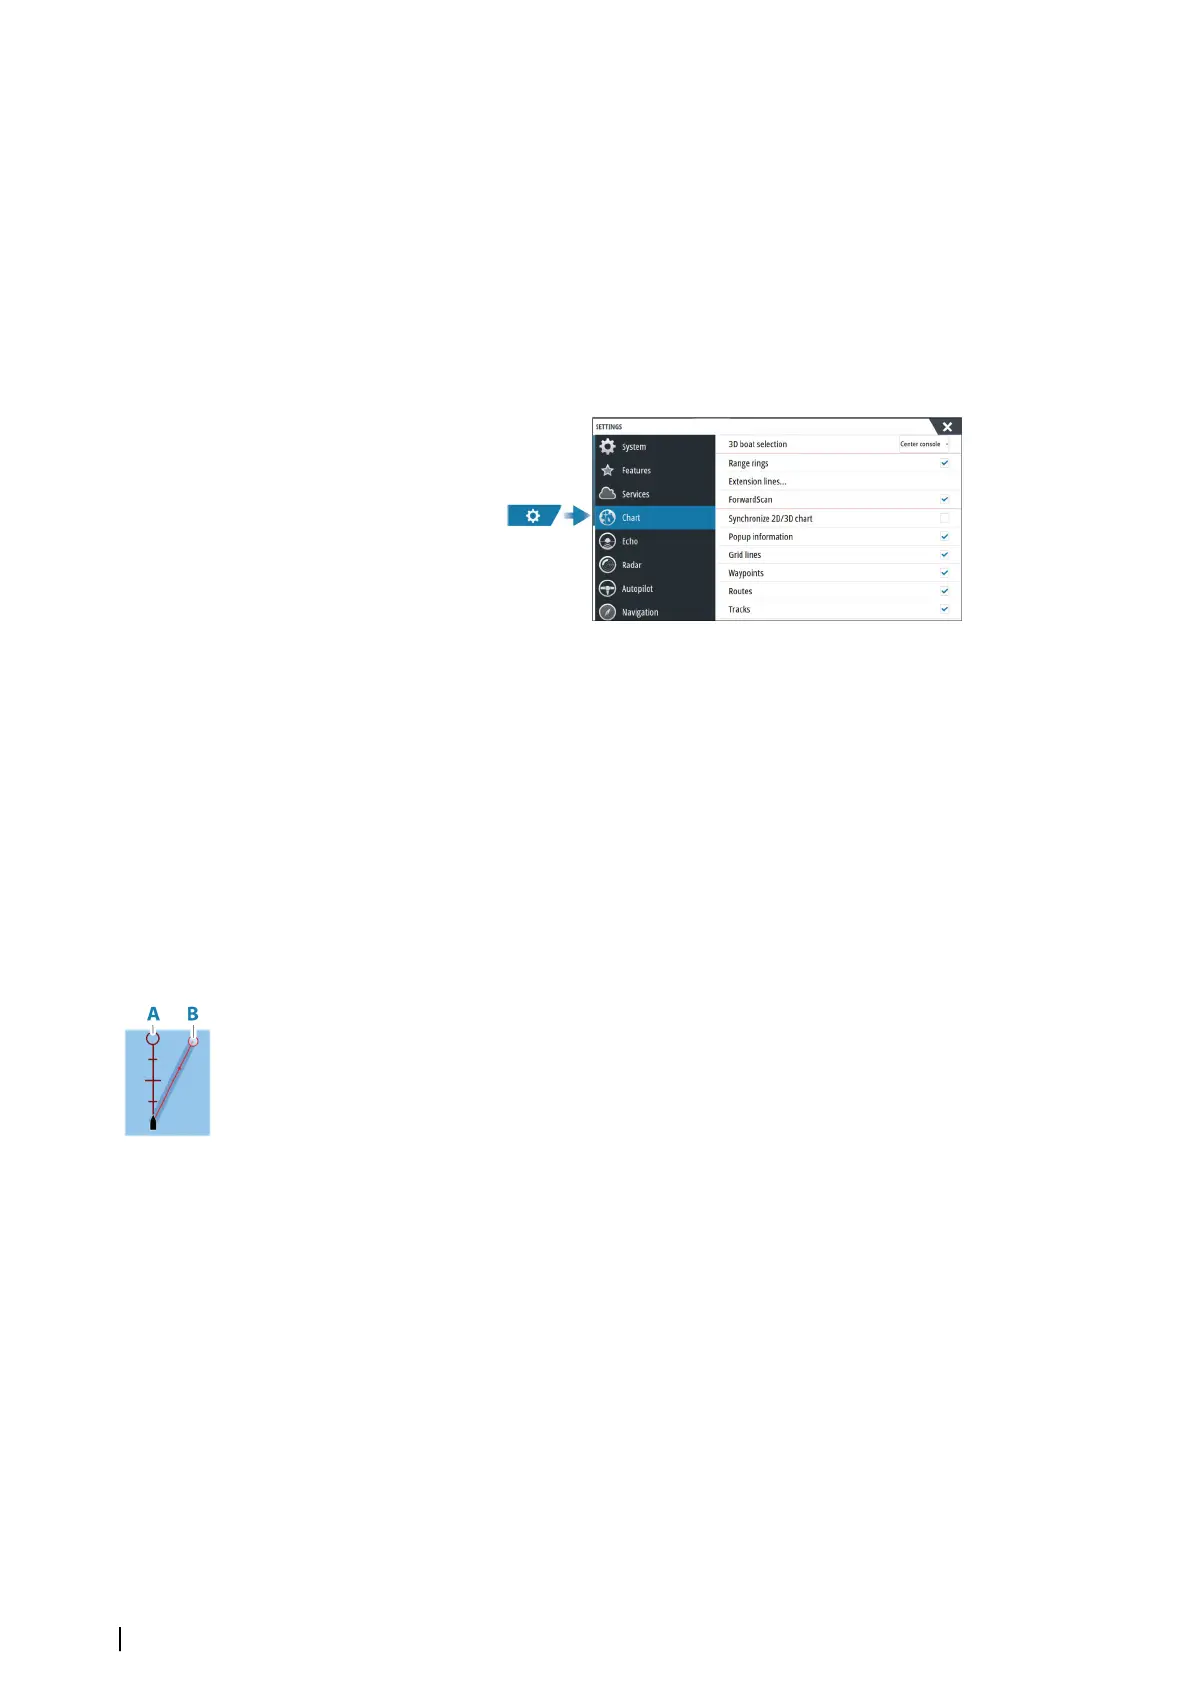
Extension lines
Sets the lengths of the extension lines for your vessel and for other vessels shown as AIS
targets.
Select to show or hide the heading and course extension lines for your vessel.
Extension length
A: Heading
B: Course Over Ground (COG)
The length of the extension line is either set as a fixed distance, or to indicate the distance
the vessel moves in the selected time period. If no options are turned on for the vessel then
no extension lines are shown.
Your vessel heading is based on information from the active heading sensor and the COG is
based on information from the active GPS sensor.
Your vessel heading and the COG is based on information from the GPS.
For other vessels, COG data is included in the message received from the AIS system.
ForwardScan
If you have ForwardScan and this option is selected, the ForwardScan heading extension is
shown on the chart. Refer to "Heading extension" on page 94.
SonarChart Live tide correction
When selected, the tide correction feature uses information from nearby tide stations (if
available) to adjust the depth values used by SonarChart Live as the sonar is recorded.
Synchronize 2D/3D chart
Links the position shown on one chart with the position shown on the other chart when a
2D and a 3D chart are shown side by side.
38
Charts | NSS evo3S Operator Manual