V1.1-OCTOBER 2019
| 39
OMNIA MPX NODE MANUAL
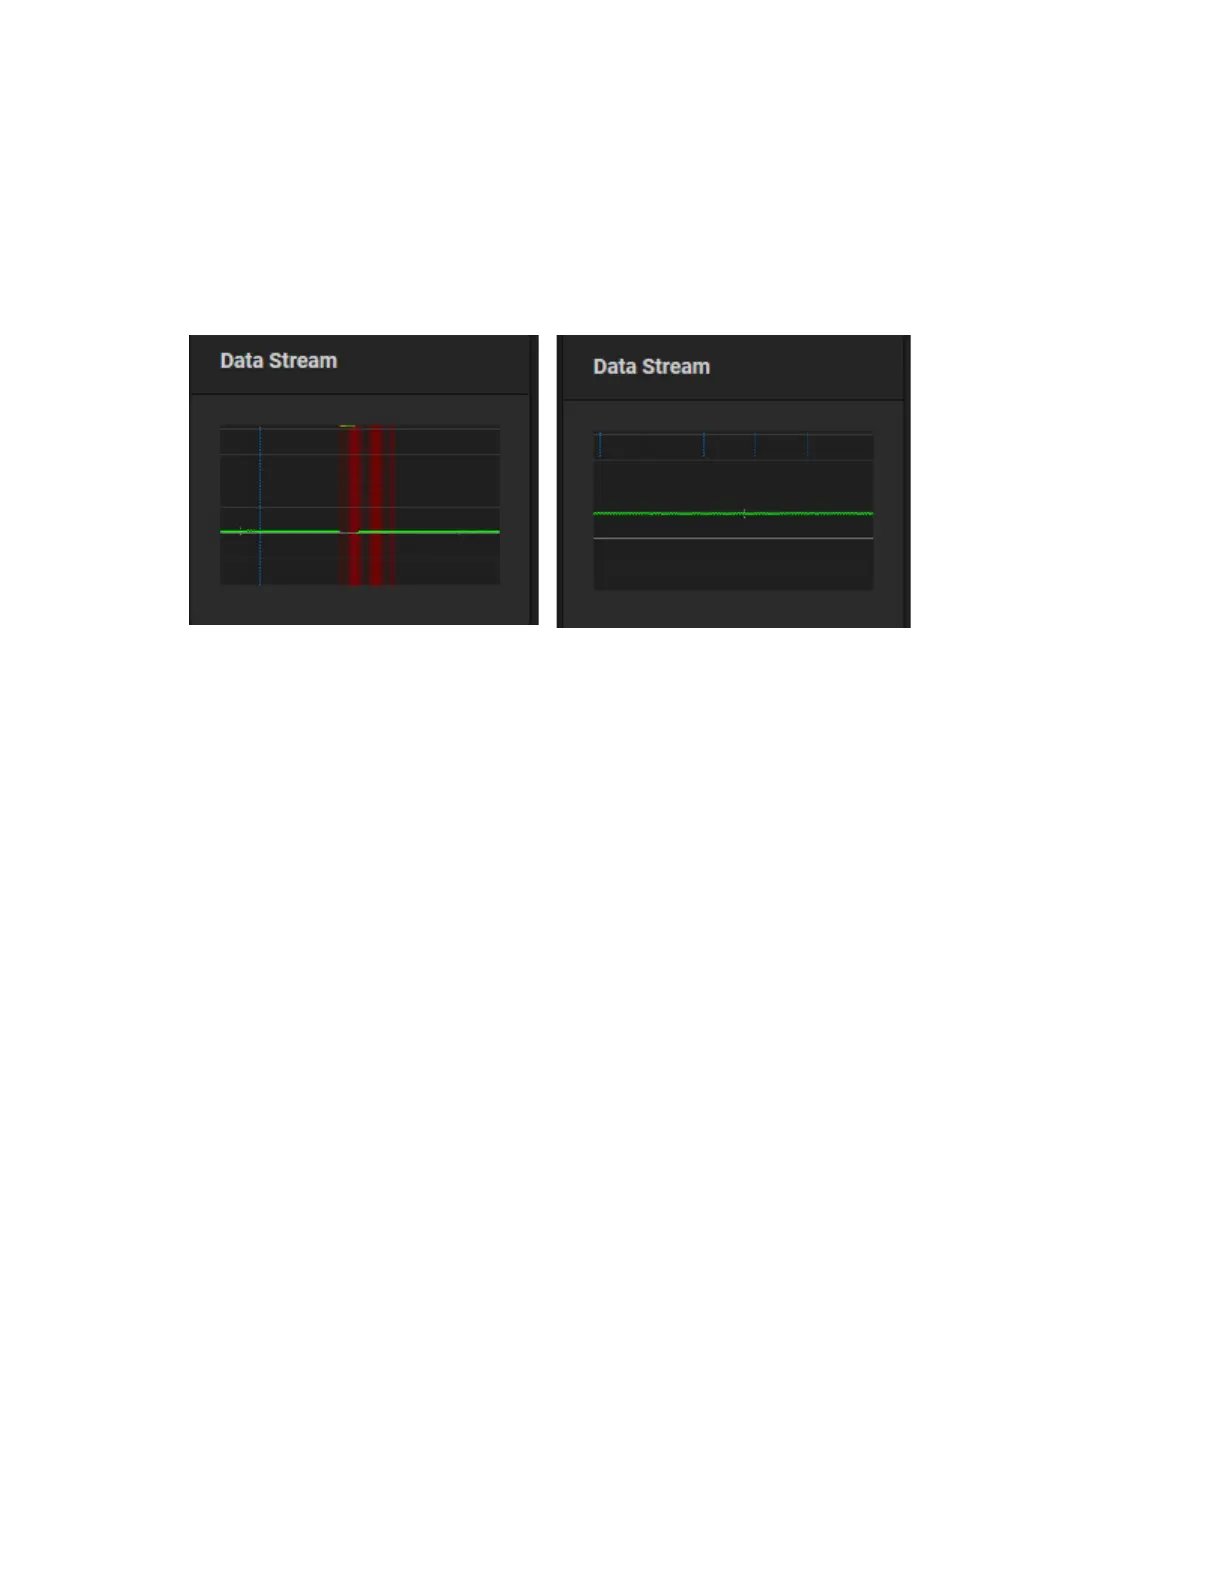
Data Stream Display
This display provides a health indication of your incoming data stream.
As you observe effects in the Data Stream display of the Decoder dashboard, you will
be able to influence this display through settings in your Encoder’s Error Correction
settings. Refer to the Stream Error Correction section of the Encoder section for more
details.
Things to note:
♦ The bolder horizontal grey line represents a 0 time delay
♦ The horizontal green line is your incoming stream. The right display above has 1
second of time delay set on the Decoder
♦ The short white lines that intersect the green stream represent the Keyframes
♦ Blue vertical lines represent error correction packets. The density of this display is
controlled by the Error Correction slider controls. The more error correction you
apply, the more blue lines you will see. If you are utilizing error correction on your
Encoder, you will need to increase the delay on your Decoder to provide buffering.
♦ Red vertical lines represent lost packets and errors. The example above is showing
serious, audible dropouts. If you frequently see packet loss on the decoder side, try
adjusting error correction settings, choose a lower Bitrate, increase your Decoder
delay, or troubleshoot your network connection, external router, or other external
components of your network .