5.2.3 Graph Scale
To set/change graph scale, tap on the menu button
of your mobile phone.
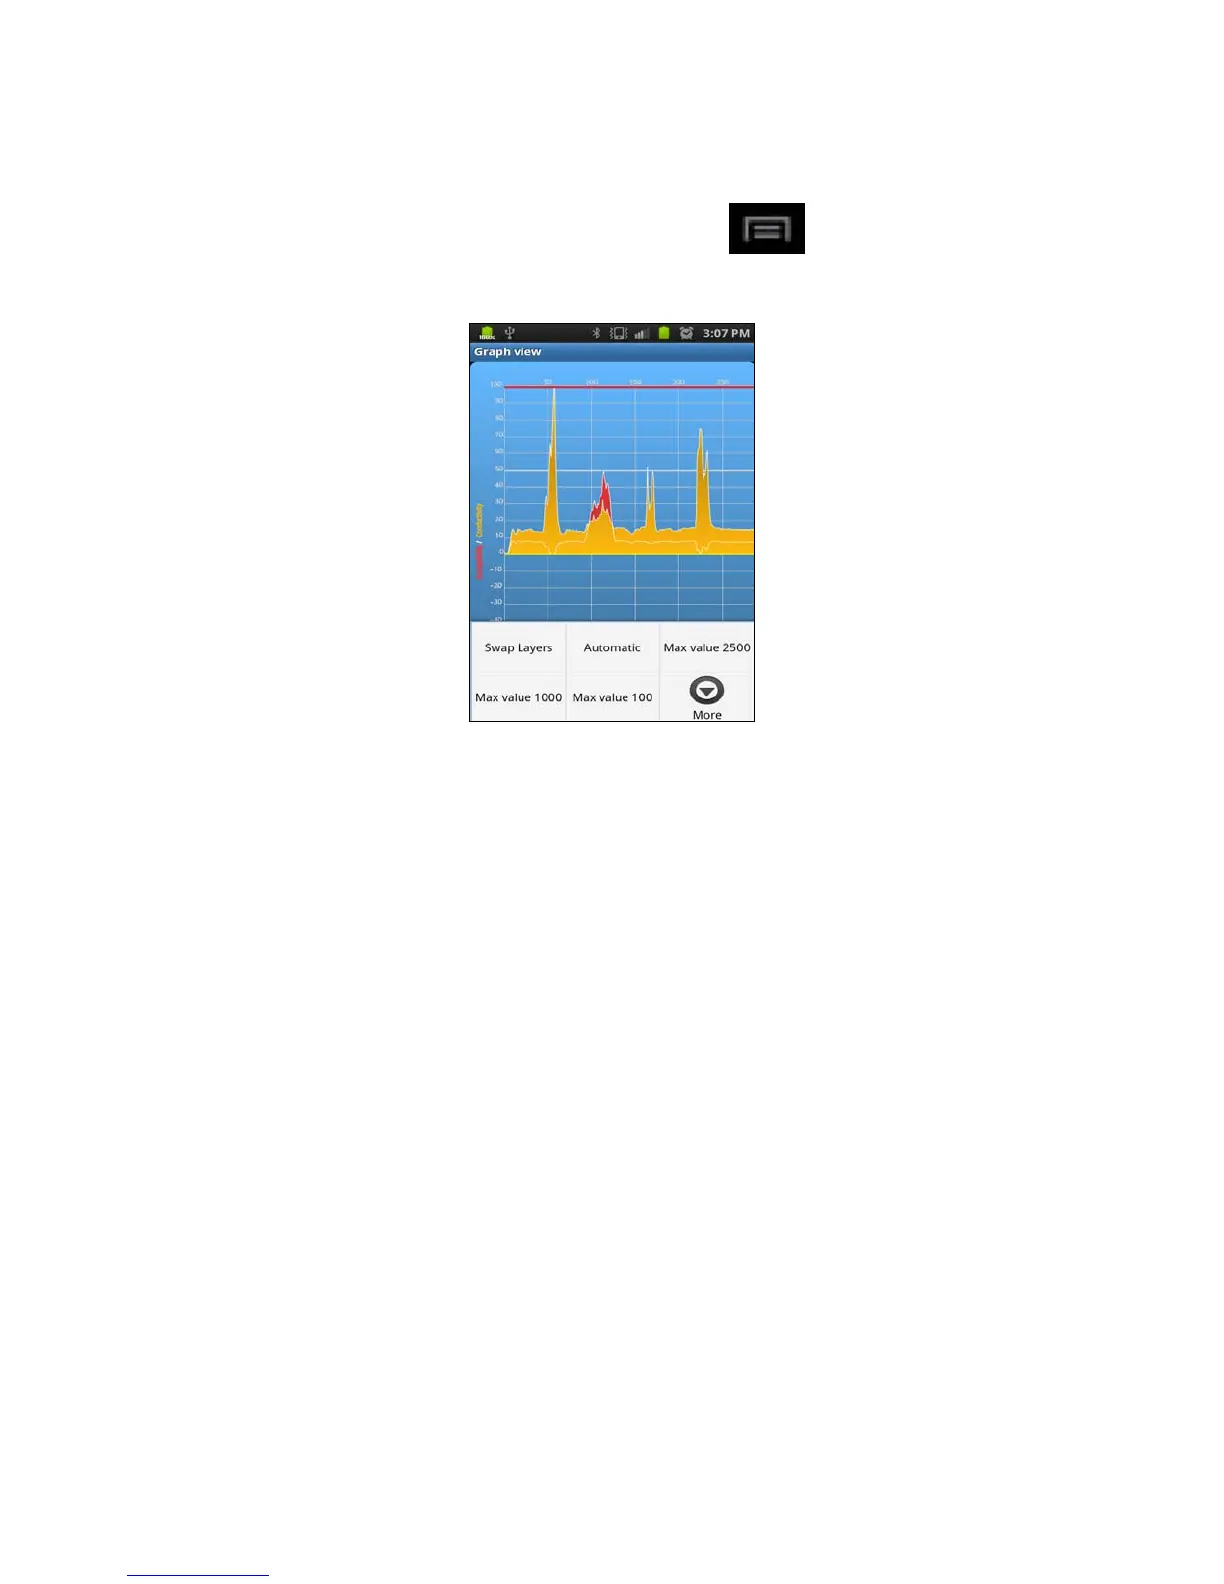
A new menu with scale options will be open up as seen in the figure 125 seen below.
Figure 125: Adjust scale – pull menu
Swap Layers:
Changes the way the graph is displayed. Normally, the graph of the Conductivity
is displayed in the foreground and susceptibility is displayed in the background.
By swapping layers, the graph of susceptibility is now placed in the foreground
and conductivity is moved to the background.
Automatic:
Sets automatic scale for the graph (Y axis) to ensure displayed graph is easier to
read.
Max value 2500:
Sets the maximum scale value of the Y axis to 2500. Scanner record with
readings over 2500 will be clipped.
Max value 1000:
Sets the maximum scale value of the Y axis to 1000. Scanner record with
readings over 1000 will be clipped.
100


 To Next Page