Chapter 9: Function Graphing
173
7309ENG.DOC CH 9 Function Graphing, English Julie Hewlett Revised: 07/29/98 12:14 PM Printed: 05/19/99
9:01 AM Page 173 of 24
Defining Window Values
If you enter a function in the Y= editor and press *, but
nothing happens or the graph doesnt look the way you expect
it to, you may need to adjust the
WINDOW
values (').
Depending upon which section of a graph you specify through
the
WINDOW
values, the display on your calculator screen can
look very different.
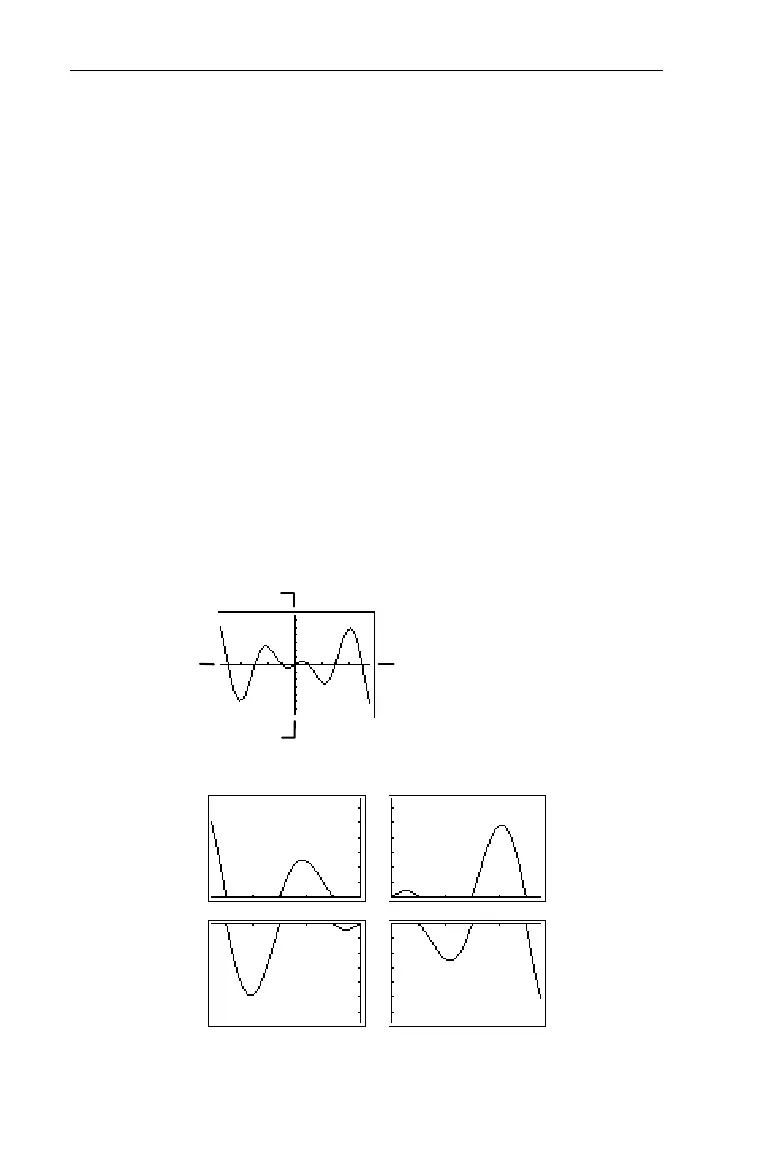
In the example below, the first calculator screen uses
WINDOW
values which include all four quadrants for the function,
Y
1
=X
¦
cos(X)
. (Calculator is in
Degree
mode.) Then, Quadrants I,
II, III, and IV are shown separately, so you can see how
WINDOW
values affect the display. The next section explains
how to redefine the values.
Xmin=
M
500
All Quadrants
Xmin=
M
500
Xmax=500
Xscl=90
Ymin=
M
500
Ymax=500
Yscl=75
1
=
¦
cos
Quadrant II
Xmin=
M
500
Xmax=0
Xscl=90
Ymin=0
Ymax=500
Yscl=75
Quadrant I
Xmin=0
Xmax=500
Xscl=90
Ymin=0
Ymax=500
Yscl=75
Quadrant III
Xmin=
M
500
Xmax=0
Xscl=90
Ymin=
M
500
Ymax=0
Yscl=75
Quadrant IV
Xmin=0
Xmax=500
Xscl=90
Ymin=
M
500
Ymax=0
Yscl=75
Ymin=
M
500
Ymax=500
Xmax=500
 Loading...