164
Chapter 9: Function Graphing
7309ENG.DOC CH 9 Function Graphing, English Julie Hewlett Revised: 07/29/98 12:14 PM Printed: 05/19/99
9:01 AM Page 164 of 24
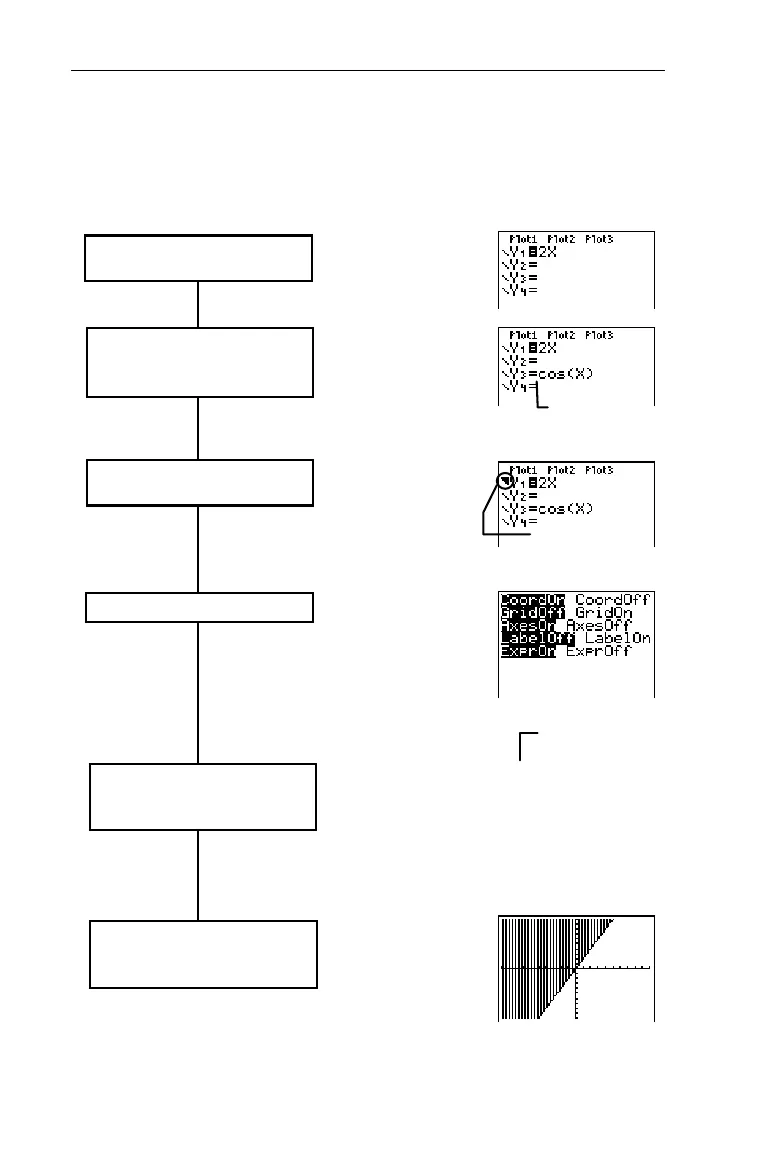
Steps for Graphing a Function
Follow these basic steps when graphing a function. You may
not have to do all of them each time.
( 6 values
Define or edit up to four functions
in the Y= editor.
Select the Y
n
function(s) that you
want to graph. Deselect statistical
plots, if desired (Chapter 7).
Define the viewing Window
values. This may include using the
ZOOM
menu.
Y
1
is selected;
Y
3
is deselected.
Set the graph style for each
selected function.
&
Highlight
=
, and then
press b to select
or deselect.
Highlight the area to
the left of
Y
n
. b
cycles through 7
styles.
Xmin=M10
Xmax=10
@x=.21276595744681
Xscl=1
Ymin=M10
Ymax=10
Yscl=1
'
or
(
The Above graph
style is selected
for
Y
1
Set the window format.
*
,
)
,
or
(
-
g
Graph the selected functions with
*. ) and ( also
automatically display the graph.
 Loading...