Chapter 6: Statistical Plots
111
7306ENG.DOC Statistical Plots and Analyses Julie Hewlett Revised: 05/29/98 3:52 PM Printed: 05/19/99 9:00 AM
Page 111 of 20
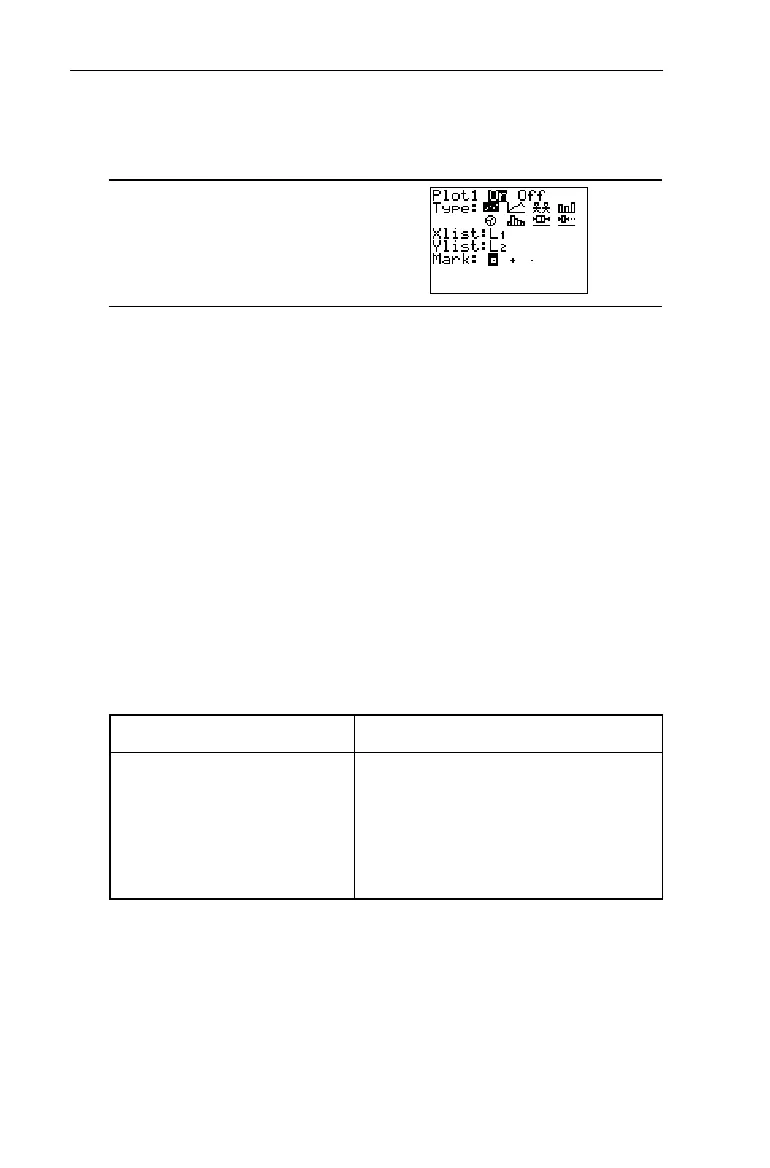
The Stat Plot Editor
-e
1, 2 or 3
If the plot has been defined previously, that information is
displayed when you select a plot number.
From the Stat Plot editor, you select (turn on) or deselect
(turn off) the stat plot, and you can select one of eight plot
types (represented as icons) as well as any options that go
with the type.
Selecting Stat Plot Types
To select a stat plot type, display the Stat Plot editor. Use $
and # to move to the
Type
line, and use " and ! to highlight
the individual
Type
icons. Once you have highlighted the
Type
icon that you want, press b to select it. The options for
the plot type then are displayed automatically.
Icon Plot Type Icon Plot Type
Ô
Scatter plot
Ï
Pie chart
Ó
xyLine plot
Ò
Histogram
Î
Pictograph
Ö
Box plot
Ð
Bar graph
Õ
Modified Box plot
 Loading...