Parametric Graphing 4-3
8304PARA.DOC TI-83 international English Bob Fedorisko Revised: 02/19/01 12:17 PM Printed: 02/19/01 1:36
PM Page 3 of 8
The horizontal component vector is
defined by
X
3T
and Y
3T
.
6. Press
~
2, and then press 1
Í
to
define
X
3T
. Press 0
Í
to define Y
3T
.
7. Press
|
|
}
Í
to change the graph
style to
è
for
X
3T
and Y
3T
. Press
}
Í
Í
to change the graph style to
ë
for
X
2T
and Y
2T
. Press
}
Í
Í
to
change the graph style to
ë
for
X
1T
and Y
1T
.
(These keystrokes assume that all graph
styles were set to
ç
originally.)
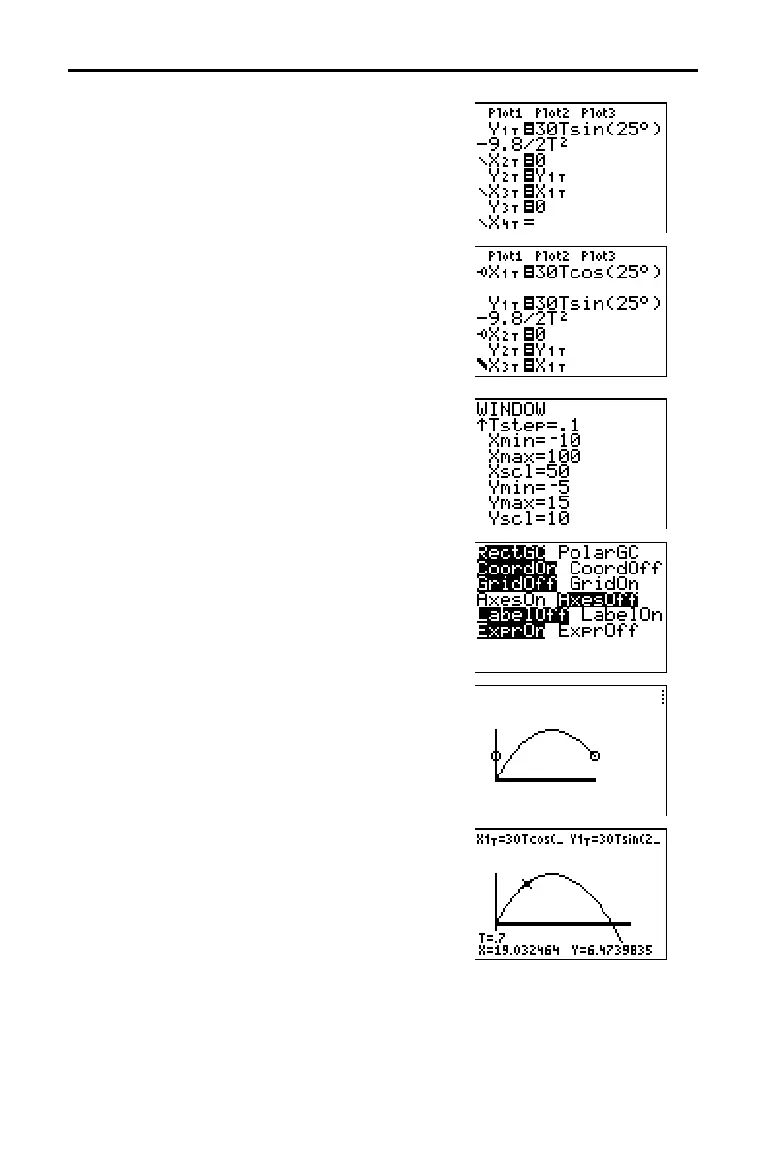
8. Press
p
. Enter these values for the
window variables.
Tmin=0 Xmin=
L
10 Ymin=
L
5
Tmax=5 Xmax=100 Ymax=15
Tstep=.1 Xscl=50 Yscl=10
9. Press
y
[
FORMAT
]
†
†
†
~
Í
to set
AxesOff, which turns off the axes.
10. Press
s
. The plotting action
simultaneously shows the ball in flight and
the vertical and horizontal component
vectors of the motion.
Tip:
To simulate the ball flying through the air, set
graph style to
ì
(animate) for
X
1T
and
Y
1T
.
11. Press
r
to obtain numerical results
and answer the questions at the beginning
of this section.
Tracing begins at
Tmin on the first
parametric equation (
X
1T
and Y
1T
). As you
press
~
to trace the curve, the cursor
follows the path of the ball over time. The
values for
X (distance), Y (height), and T
(time) are displayed at the bottom of the
screen.

 Loading...


