Lists 11-13
8311LIST.DOC TI-83 international English Bob Fedorisko Revised: 02/19/01 1:21 PM Printed: 02/19/01 1:37 PM
Page 13 of 18
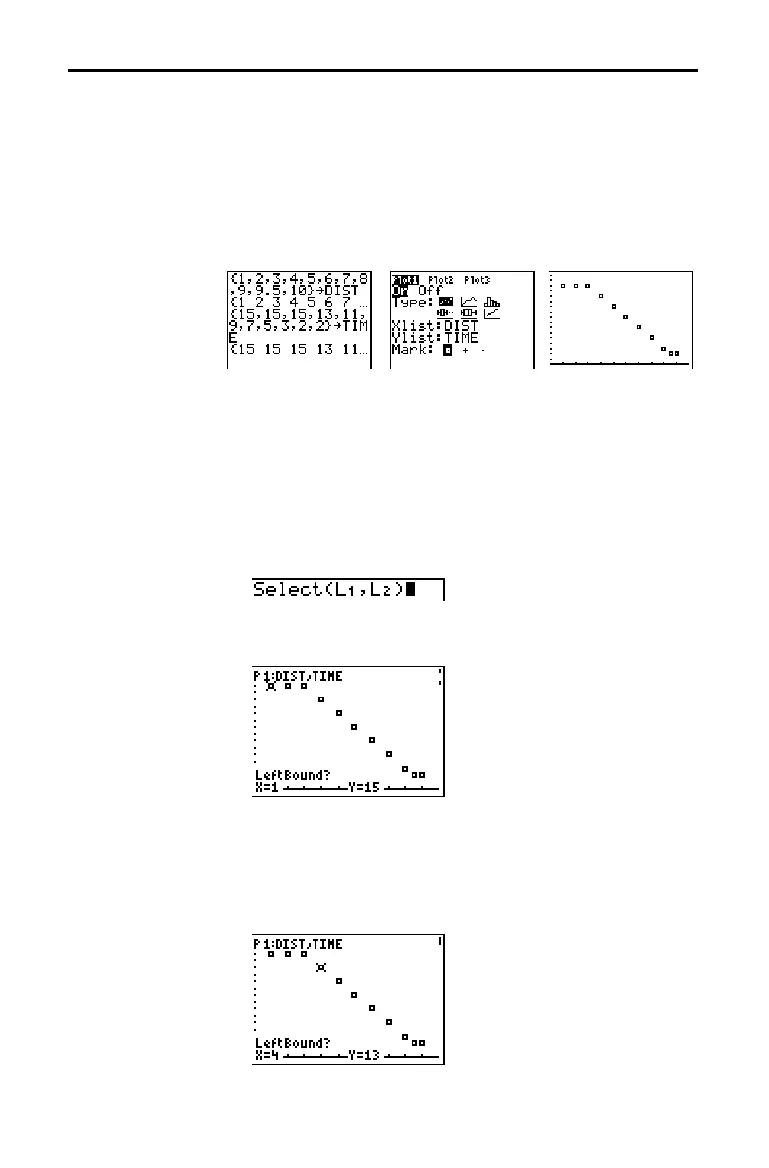
Before using Select(, follow these steps.
1. Create two list names and enter the data.
2. Turn on a stat plot, select
"
(scatter plot) or
Ó
(xyLine),
and enter the two list names for
Xlist: and Ylist: (Chapter
12).
3. Use
ZoomStat to plot the data (Chapter 3).
To select data points from a scatter plot or xyLine plot,
follow these steps.
1. Press
y
[
LIST
]
~
8 to select 8:Select( from the
LIST
OPS
menu. Select( is pasted to the home screen.
2. Enter
xlistname
, press
¢
, enter
ylistname
, and then
press
¤
to designate list names into which you want
the selected data to be stored.
3. Press
Í
. The graph screen is displayed with
Left Bound? in the bottom-left corner.
4. Press
}
or
†
(if more than one stat plot is selected) to
move the cursor onto the stat plot from which you want
to select data points.
5. Press
|
and
~
to move the cursor to the stat plot data
point that you want as the left bound.
Before Using
Select(
Using Select( to
Select Data
Points from a
Plot

 Loading...


