Financial Functions 14-11
8314FINA.DOC TI-83 international English Bob Fedorisko Revised: 02/19/01 12:50 PM Printed: 02/19/01 1:38 PM
Page 11 of 14
6. Press
p
to display the window variables. Enter
the values below.
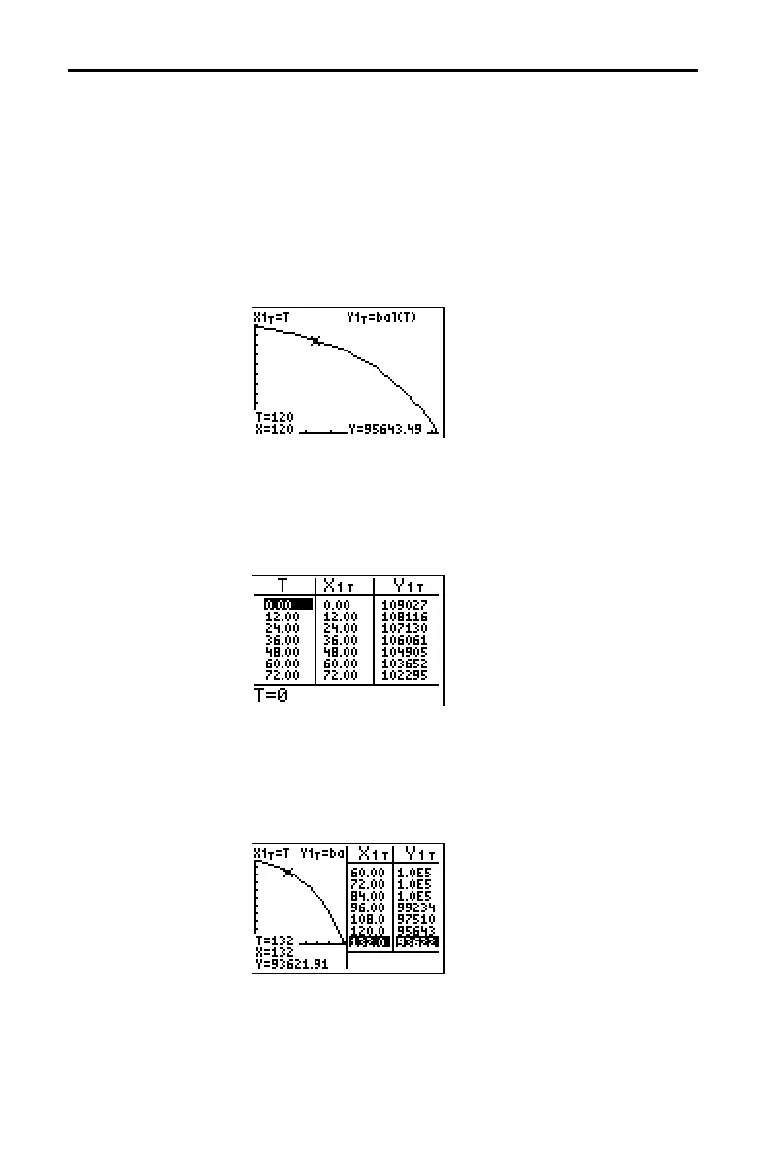
Tmin=0 Xmin=0 Ymin=0
Tmax=360 Xmax=360 Ymax=125000
Tstep=12 Xscl=50 Yscl=10000
7. Press
r
to draw the graph and activate the trace
cursor. Press
~
and
|
to explore the graph of the
outstanding balance over time. Press a number and then
press
Í
to view the balance at a specific time
T.
8. Press
y
[
TBLSET
] and enter the values below.
TblStart=0
@
Tbl=12
9. Press
y
[
TABLE
] to display the table of outstanding
balances (
Y
1T
).
10.Press
z
†
†
†
†
†
†
†
~
~
Í
to select G
.
T
split-screen mode, in which the graph and table are
displayed simultaneously.
Press
r
to display
X
1T
(time) and Y
1T
(balance) in
the table.

 Loading...


