Applications 17-19
8317APPS.DOC TI-83 international English Bob Fedorisko Revised: 02/19/01 1:00 PM Printed: 02/19/01 1:39 PM
Page 19 of 20
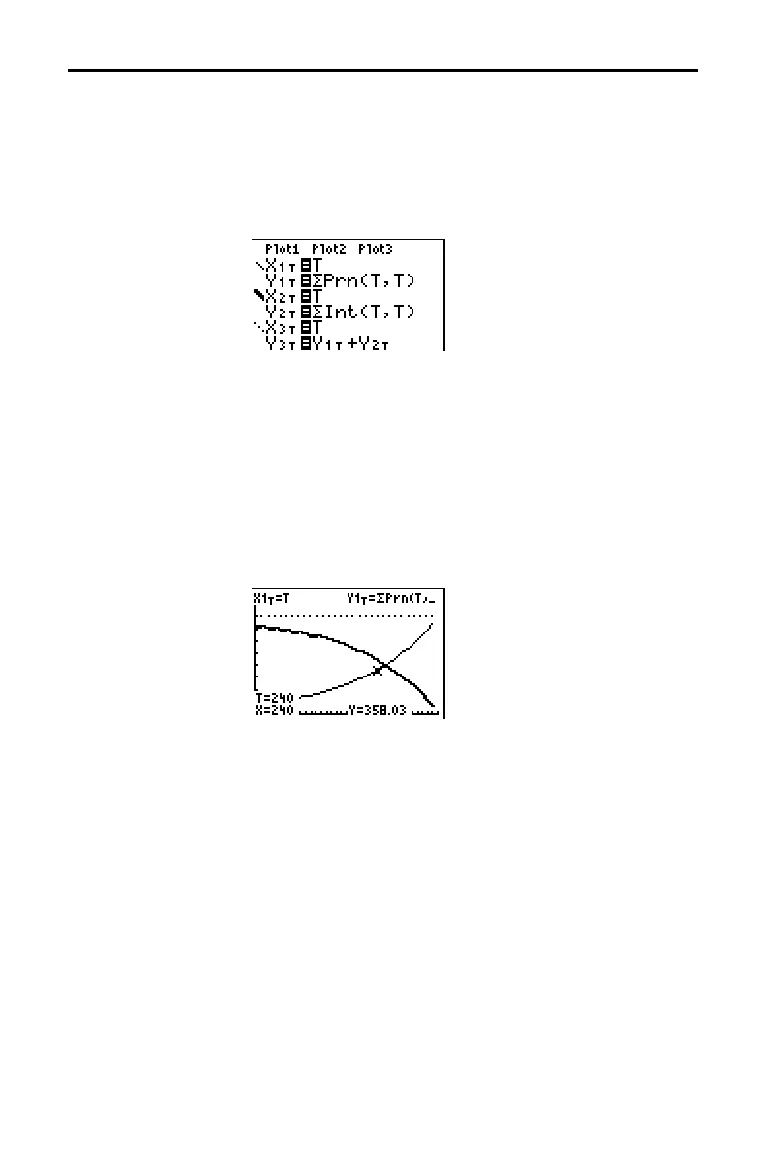
Now compare the graph of the amount of interest with the
graph of the amount of principal for each payment.
4. Press
z
. Set
Par and Simul.
5. Press
o
. Turn off all functions and stat plots. Enter
these equations and set the graph styles as shown.
Note:
G
Prn(
and
G
Int(
are located on the
FINANCE CALC
menu.
6. Press
p
. Set these window variables.
Tmin=1 Xmin=0 Ymin=0
Tmax=360 Xmax=360 Ymax=1000
Tstep=12 Xscl=10 Yscl=100
Tip:
To increase the graph speed, change
Tstep
to
24
.
7. Press
r
. After the graph is drawn, press 240
Í
to move the trace cursor to
T=240, which is equivalent
to 20 years of payments.
The graph shows that for the 240th payment (X=240),
358.03 of the 800 payment is applied to principal
(
Y=358.03).
Note:
The sum of the payments (
Y
3T
=Y
1T
+Y
2T
) is always 800.
 Loading...


