Previews 106
Note: If you don’t need to save the current variable, use it as a scratchpad. The next time
you need a variable for temporary data, clear the current variable and re-use it. This lets
you enter temporary data without creating a new variable each time, which uses up
memory.
Statistics and Data Plots
Based on a sample of seven cities, enter data that relates population to the number of
buildings with more than 12 stories. Using Median-Median and linear regression
calculations, find and plot equations to fit the data. For each regression equation, predict
how many buildings of more than 12 stories you would expect in a city of 300,000
people.
5. Clear the contents of the variable.
Simply clearing the data does not convert
the data variable back into a list variable.
Press , 8 ¸
Steps and keystrokes Display
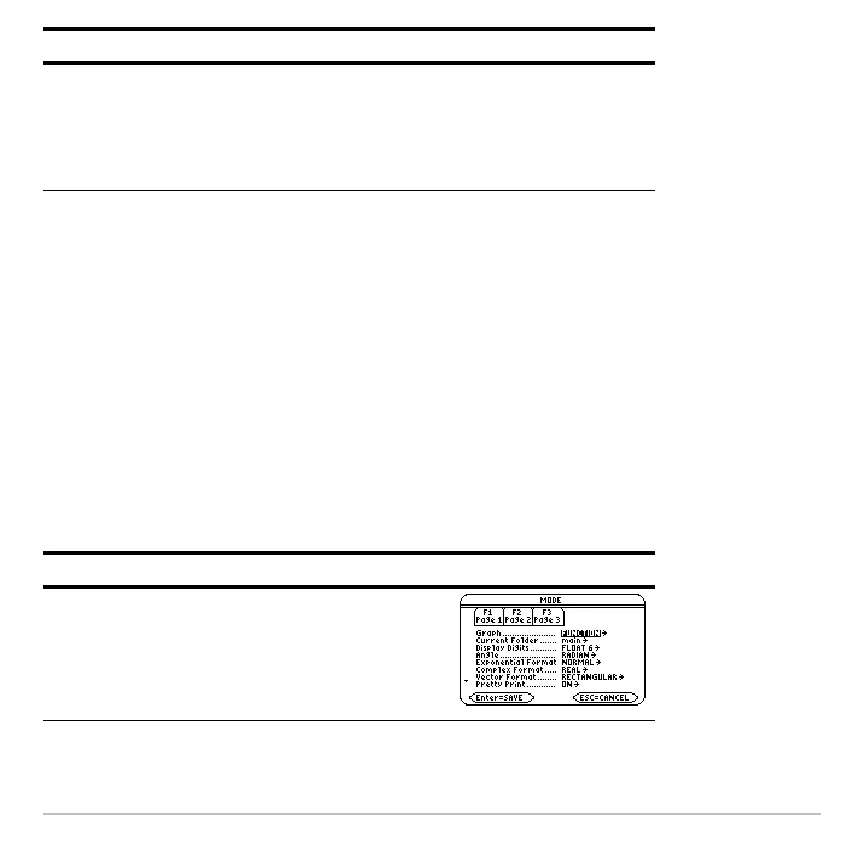
1. Display the MODE dialog box. For Graph
mode, select
FUNCTION.
Press 3 B 1 ¸
Steps and keystrokes Display