Basic Function Graphing 292
the current graphing mode. For example, in POLAR graphing mode, function names are
r1(q), r2(q), etc.)
Defining a New Function
1. Press 8# to display the Y= Editor.
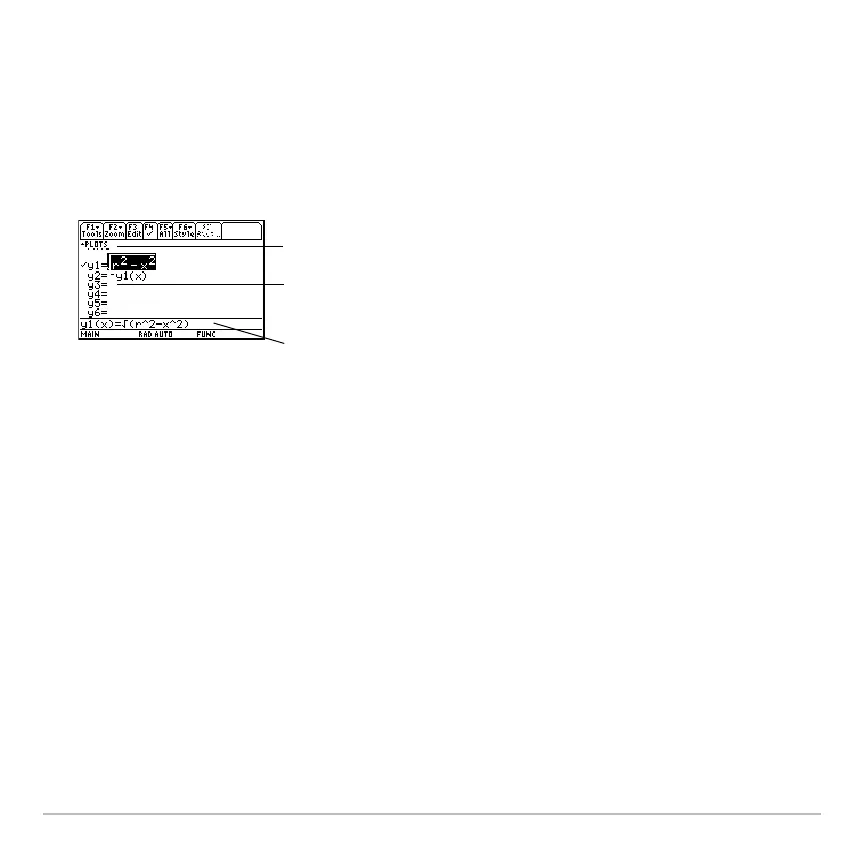
Note: The function list shows abbreviated function names such as y1, but the entry
line shows the full name
y1(x).
2. Press D and C to move the cursor to any undefined function. (Use 2D and
2C to scroll one page at a time.)
3. Press ¸ or … to move the cursor to the entry line.
4. Type the expression to define the function.
• The independent variable in function graphing is x.
• The expression can refer to other variables, including matrices, lists, and other
functions. Only floats and lists of floats will produce a plot.
Note: For an undefined function, you do not need to press ¸ or …. When you
begin typing, the cursor moves to the entry line.
5. When you complete the expression, press ¸.
Plots — You can scroll above y1= to see
a list of stat plots.
Function List — You can scroll through
the list of functions and definitions.
Entry Line — Where you define or edit the
function highlighted in the list.