Polar Graphing 326
Polar Graphing
Overview of Steps in Graphing Polar Equations
To graph polar equations, use the same general steps used for y(x) functions as
described in Basic Function Graphing. Any differences that apply to polar equations are
described on the following pages.
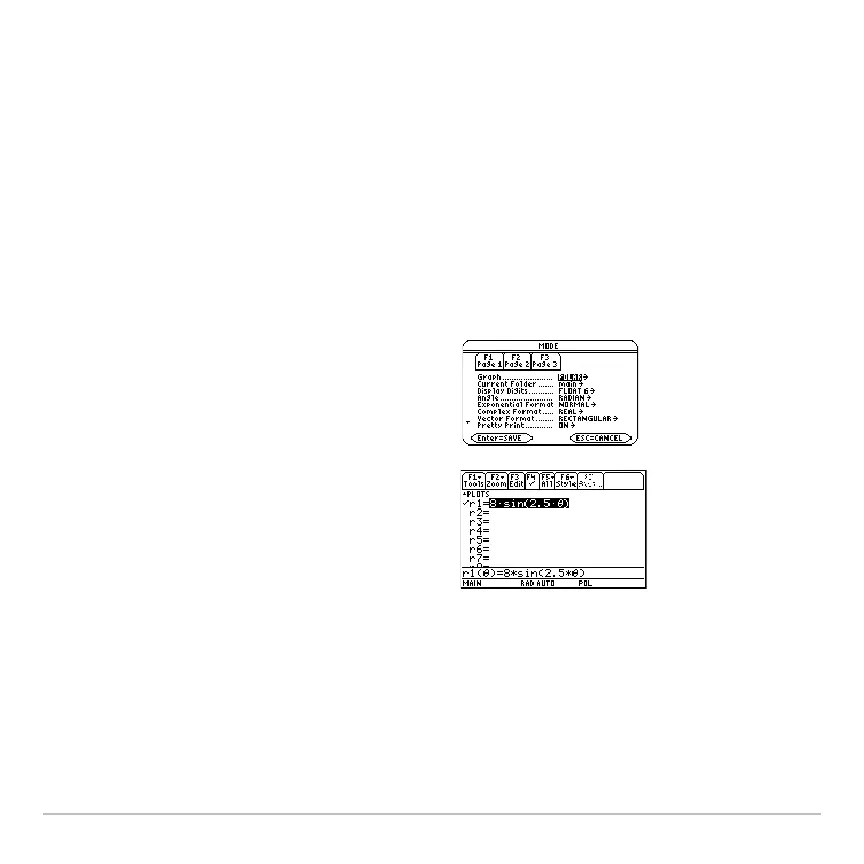
Graphing Polar Equations
1. Set
Graph mode (3) to POLAR. Also
set
Angle mode, if necessary.
2. Define x and y components on Y= Editor
(8#).
3. Select (†) which defined equations to
graph. Select the x or y component, or
both.
Note: To turn off any stat data plots press
‡
5 or use † to deselect them.