EasyManuals Logo

Texas Instruments TI-89 Titanium User Manual

Texas Instruments TI-89 Titanium
977 pages
To Next Page IconTo Next Page
To Previous Page IconTo Previous Page
Page #358 background imageLoading...
Page #358 background image
Sequence Graphing 355
Example: Oscillation
This example shows how the initial value can affect a sequence.
1. On the Y= Editor (8#), use the same sequence defined in the divergence
example: u1(n) = 3.2u1(nN1) N .8(u1(nN1))
2
. Set initial value ui1 = 0.5.
2. Set
Axes = TIME.
3. On the Window Editor (8$), set the Window variables.
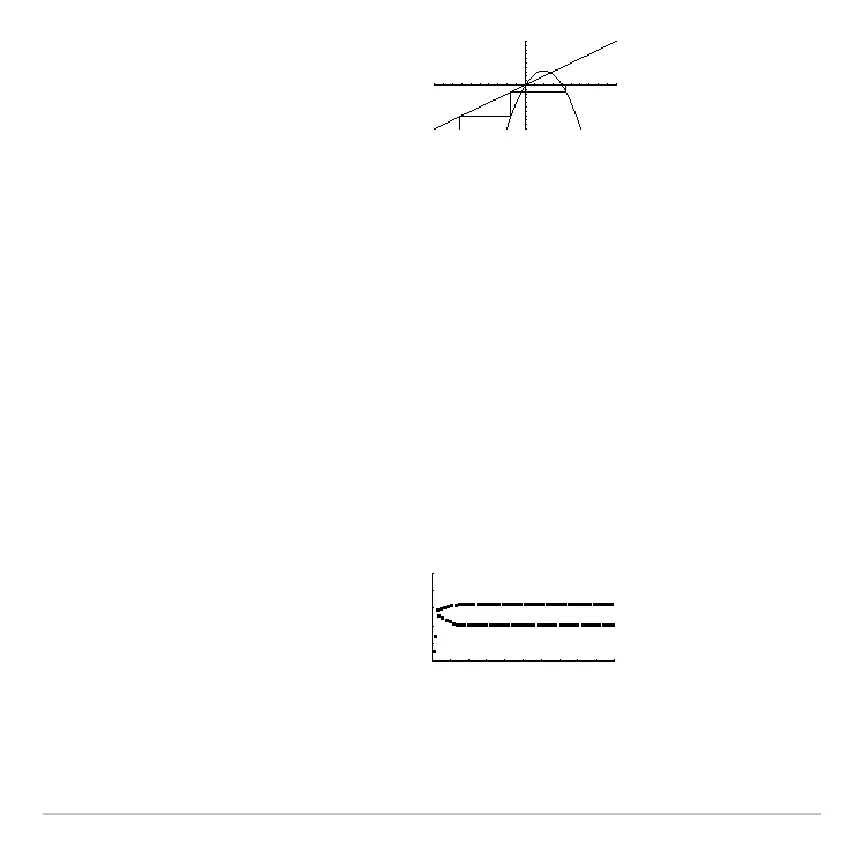
5. On the Y= Editor, set
Axes = WEB and Build Web = AUTO.
7. Regraph the sequence.
The web plot shows how quickly the
sequence diverges to large negative
values.
nmin=1
nmax=100
plotstrt=1
plotstep=1
xmin=0
xmax=100
xscl=10
ymin=0
ymax=5
yscl=1
4. Graph the sequence (8%).
Note: Compare this graph with the
divergence example. This is the same
sequence with a different initial value.
y=3.2xN.8x
2
u(nN1)
u(n
y=x
u(n)
n

Table of Contents

Other manuals for Texas Instruments TI-89 Titanium

Questions and Answers:

Question and Answer IconNeed help?

Do you have a question about the Texas Instruments TI-89 Titanium and is the answer not in the manual?

Texas Instruments TI-89 Titanium Specifications

General IconGeneral
Display TypeLCD
Display Resolution160 x 100 pixels
CPUMotorola 68000
CPU Speed16 MHz
RAM256 KB
Flash ROM2.7 MB
Programming LanguageTI-BASIC, Assembly
Power Source4 AAA batteries
ConnectivityI/O port
Dimensions7.5 x 3.5 x 1 inches

Related product manuals