Sequence Graphing 354
Example: Divergence
1. On the Y= Editor (8 #), define u1(n) = 3.2u1(nN1) N .8(u1(nN1))
2
. Set initial value
ui1 = 4.45.
2. Set
Axes = TIME.
3. On the Window Editor (8$), set the Window variables.
5. On the Y= Editor, set
Axes = WEB and Build Web = AUTO.
6. On the Window Editor (8$), set the Window variables.
nmin=0
nmax=10
plotstrt=1
plotstep=1
xmin=0
xmax=10
xscl=1
ymin=
L75
ymax=10
yscl=1
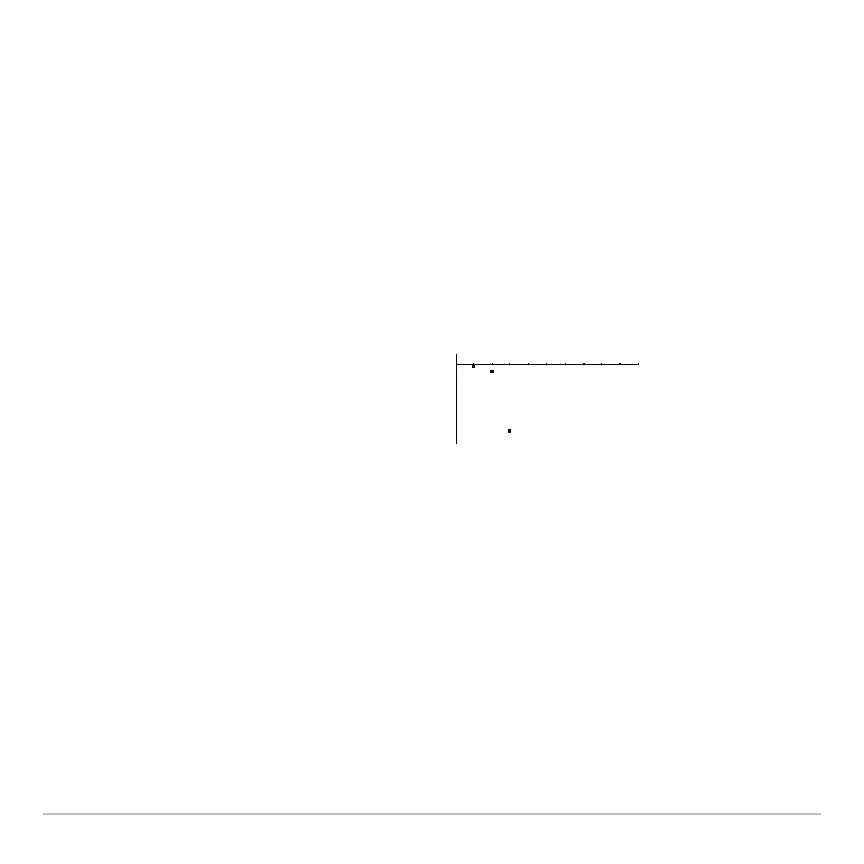
4. Graph the sequence (8 %).
Because the sequence quickly
diverges to large negative values,
only a few points are plotted.
nmin=0
nmax=10
plotstrt=1
plotstep=1
xmin=
L10
xmax=10
xscl=1
ymin=L10
ymax=10
yscl=1
u(n)
n