3D Graphing 386
Drawing a Contour for the Z Value of a Selected Point Interactively
If a contour graph is currently displayed, you can specify a point on the graph and draw a
contour for the corresponding z value.
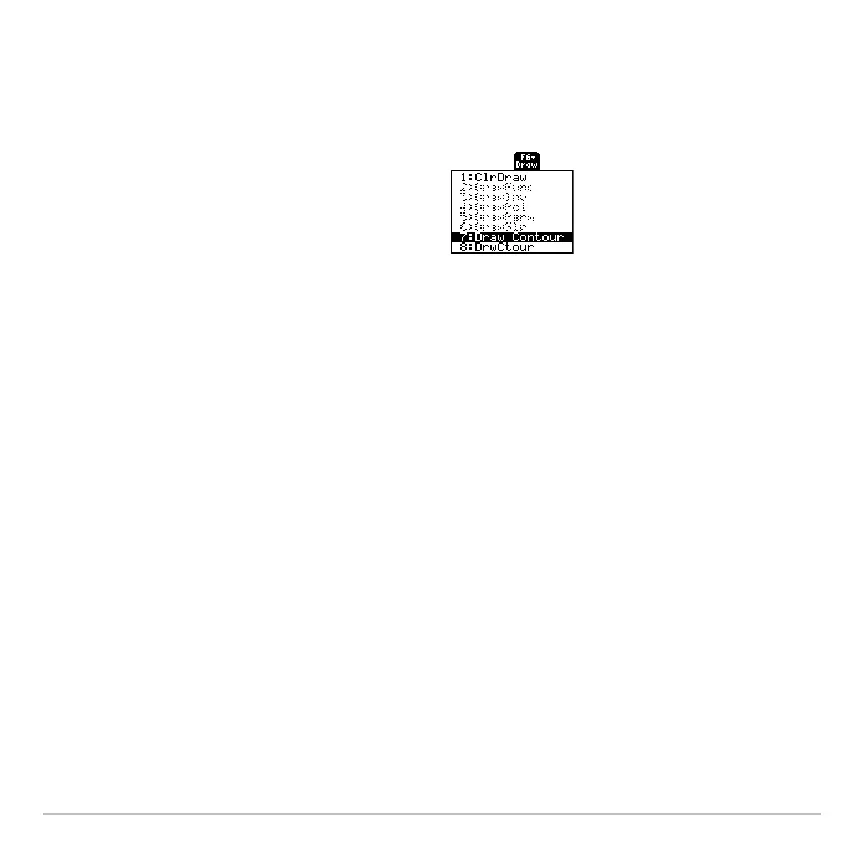
2. Select
7:Draw Contour.
3. Either:
• Type the point’s x value and press ¸, and then type the y value and press
¸.
– or –
• Move the cursor to the applicable point. (The cursor moves along the grid lines.)
Then press ¸.
For example, suppose the current graph is z1(x,y)=x
2
+.5y
2
–5. If you specify x=2 and
y=3, a contour is drawn for z=3.5.
Note: Any existing contours remain on the graph. To remove the default contours, display
the Window editor (8$) and set
ncontour=0.
1. To display the
Draw menu, press:
2 ˆ