3D Graphing 389
5. Press 8% to graph the equation.
It will take awhile to evaluate the graph; so be patient. When the graph is displayed,
the complex modulus surface touches the xy plane at exactly the complex zeros of
the polynomial:
L ,
i, and i
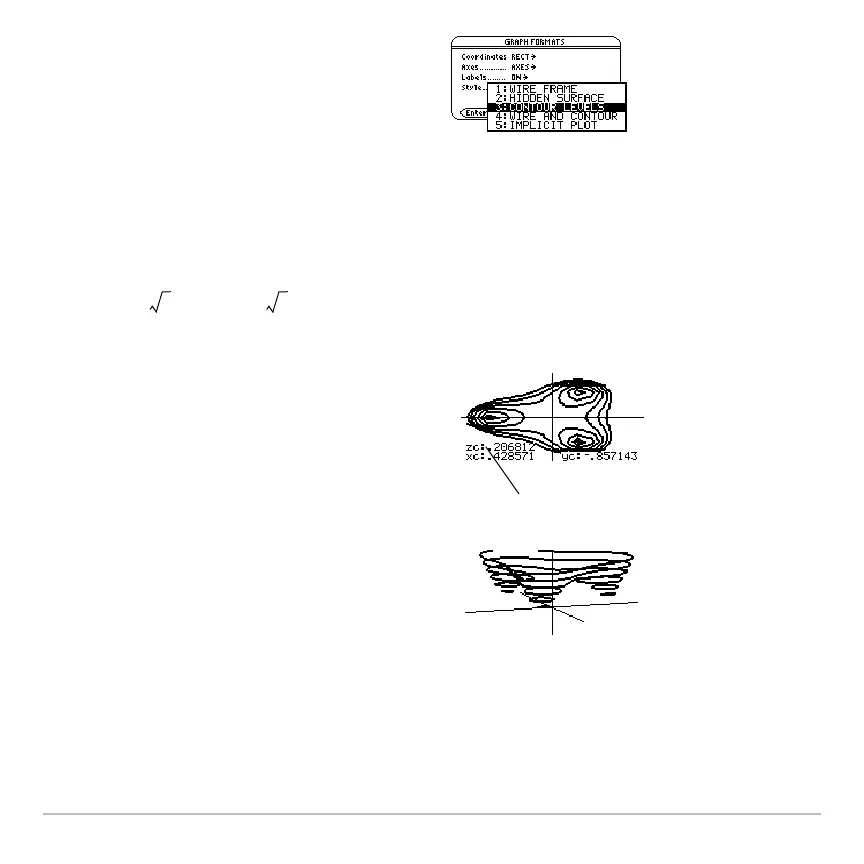
4. Display the Graph Formats dialog box:
8 Í Turn on the axes, set
Style = CONTOUR LEVELS, and return to
the Window editor.
6. Press …, and move the trace cursor to
the zero in the fourth quadrant.
The coordinates let you estimate
.428–.857
i as the zero.
7. Press N. Then use the cursor keys to
animate the graph and view it from
different eye angles.
This example shows
eyeq=70, eyef=70,
and eye
ψ=0.
1
1
2
---
3
2
-------+
1
2
---
3
2
-------–
The zero is precise
when z=0.