3D Graphing 394
Example
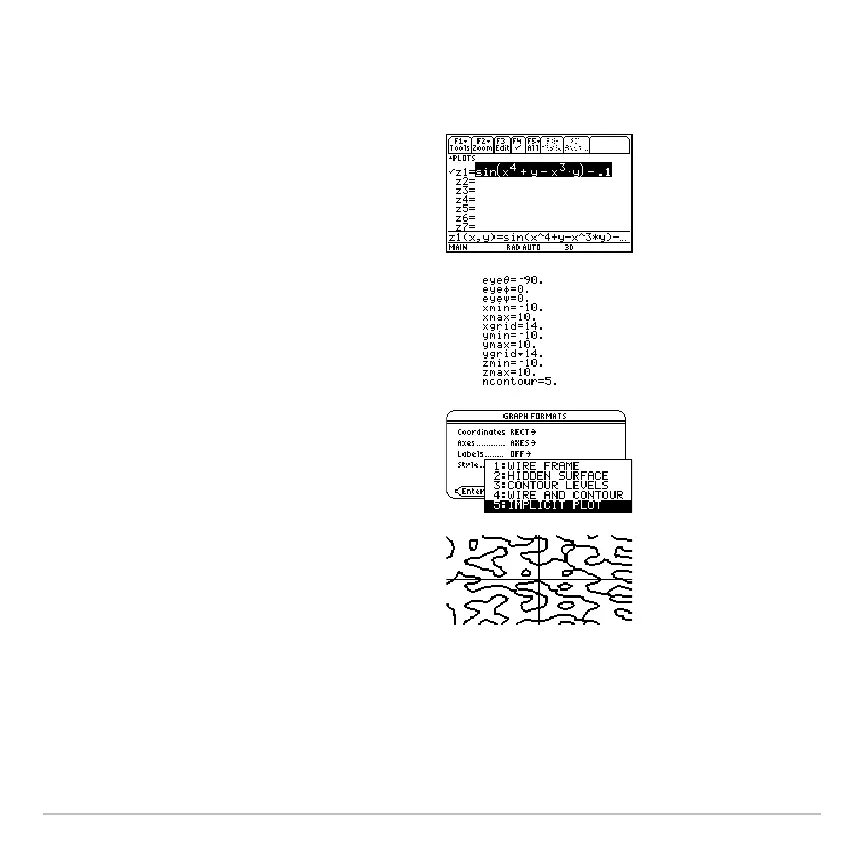
Graph the equation sin(x
4
+y–x
3
y) = .1.
1. Use 3 to set
Graph=3D.
2. Press 8#, and define the equation:
z1(x,y)=sin(x^4+y– x^3y)–.1
3. Press 8$, and set the Window
variables as shown.
4. Press:
8 ÍTurn on the axes, set
Style = IMPLICIT PLOT, and return to the
Window editor.
5. Press 8% to graph the equation.
It will take awhile to evaluate the graph;
so be patient.
The graph shows where
sin(x
4
+y–x
3
y) = .1