Differential Equation Graphing 423
4. In the Y= Editor, press:
@2 ‰ Set
Axes = TIME.
5. In the Window Editor (8$), set
the Window variables.
t0=0
tmax=10
tstep=p/24
tplot=0
xmin=
L1
xmax=10
xscl=5
ymin=L10
ymax=40
yscl=5
ncurves=0
diftol=.001
6. Graph the differential equations
(8%).
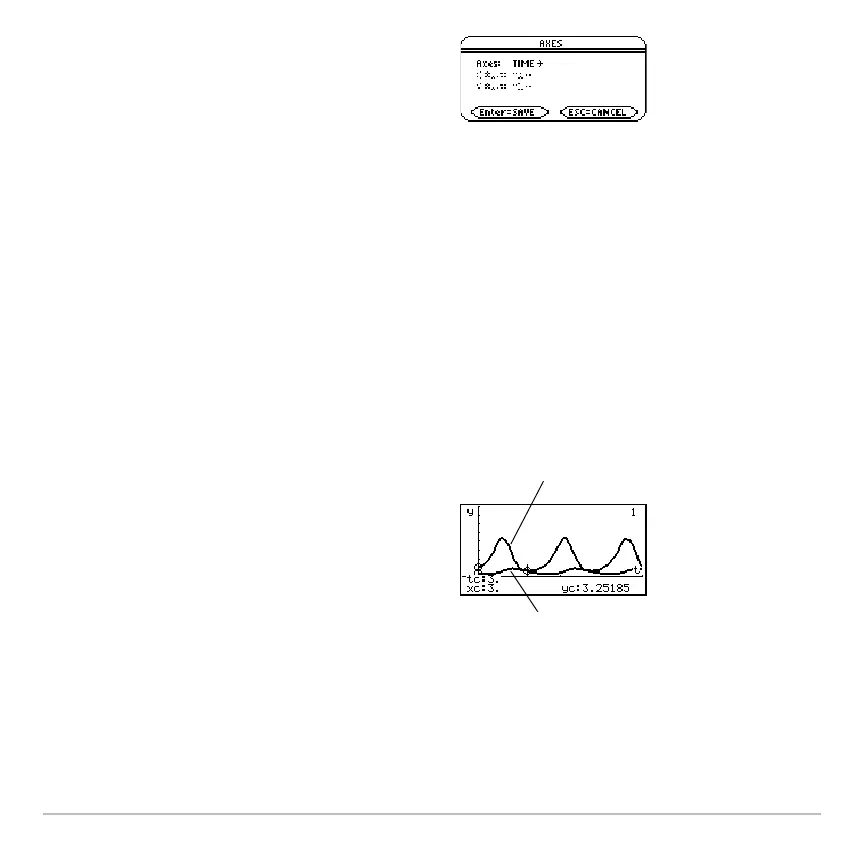
7. Press …
to trace. Then press 3 ¸ to
see the number of foxes (
yc for y1) and
rabbits (
yc for y2) at t=3.
Note: Use C and D to move the trace
cursor between the curves for
y1 and y2.
y2(t)
y1(t)