Differential Equation Graphing 428
10. Use the Data/Matrix Editor (O) to
create a new data variable named
errorlog.
Note: errorlog lets you combine the data
in
rklog and eulerlog so that you can view
the two sets of data side by side.
11. In this new data variable, define the
c1,
c2, and c3 column headers to refer to data
in
rklog and eulerlog. Also, enter column
titles as shown.
To define a column header, move the
cursor to that column, press †, type the
reference expression (such as
rklog[1] for
c1), and press ¸.
Note: rklog[1] and rklog[2] refer to
column 1 and 2 in
rklog, respectively.
Likewise with
eulerlog[2].
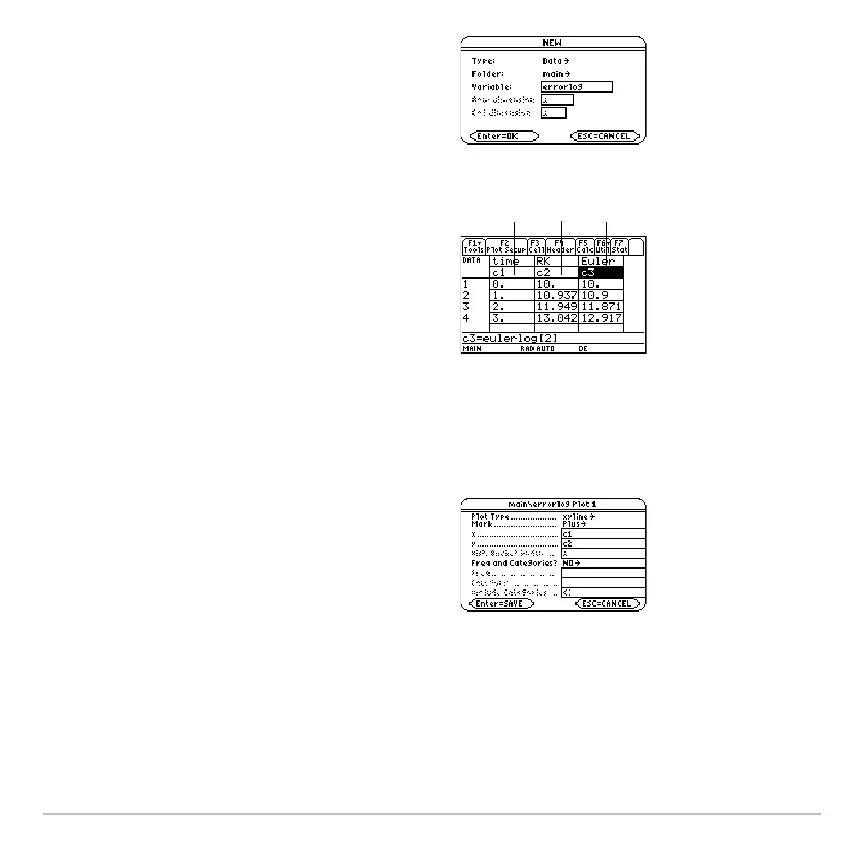
12. In the
Data/Matrix Editor, press „. Then
press , and define
Plot 1 for the RK
data, as shown to the right.
13. Define
Plot 2 for the Euler data. Use the
values shown to the right.
Plot Type=xyline
Mark=Cross
x=c1
y=c3
14. Return to the Y= Editor, press 3, and
set
Graph = FUNCTION.
Ê c1=rklog[1] or
c1=eulerlog[1]
Ë c2=rklog[2]
Ì c3= eulerlog[2]
ÊËÌ