Statistics and Data Plots 540
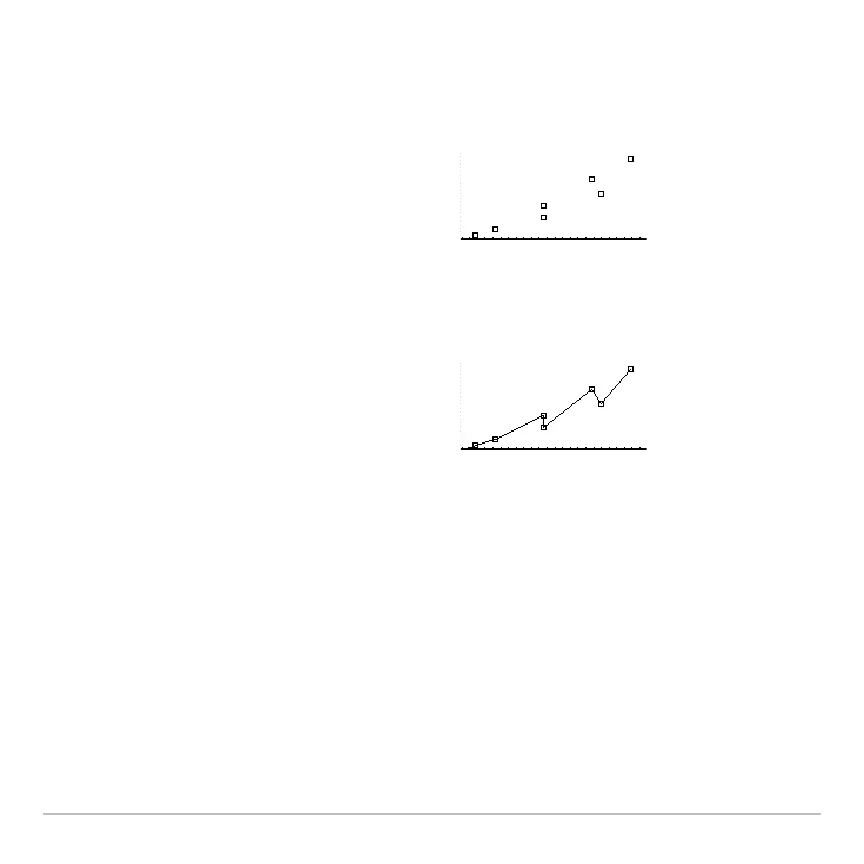
Scatter
Data points from x and y are plotted as coordinate pairs. Therefore, the columns or lists
that you specify for x and y must be the same length.
Xyline
• Plotted points are shown with the symbol
that you select as the Mark.
• If necessary, you can specify the same
column or list for both x and y.
This is a scatter plot in which data points are
plotted and connected in the order in which
they appear in x and y.
You may want to sort all the columns in the
Data/Matrix Editor before plotting.
@2ˆ
3 or 2 ˆ 4
 Loading...


