Previews 94
Note: You can also display the graph as an implicit plot by using the GRAPH FORMATS
dialog box (8 Í). If you press: Í to switch between styles, the implicit plot is not
displayed.
Differential Equation Graphing
Graph the solution to the logistic 1st-order differential equation y' = .001y…(100Ny). Start
by drawing only the slope field. Then enter initial conditions in the
Y= Editor and
interactively from the Graph screen.
Steps and keystrokes Display
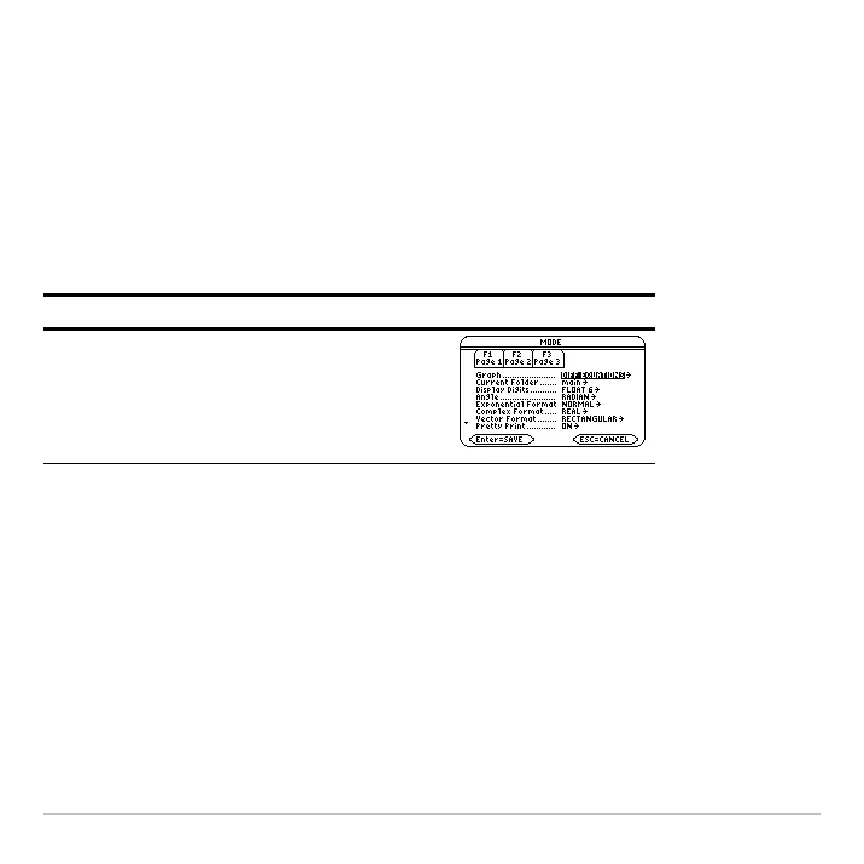
1. Display the MODE dialog box. For Graph
mode, select
DIFF EQUATIONS.
Press 3 B 6 ¸