74 DCx camera
© 2010 Thorlabs
6.7
Histogram
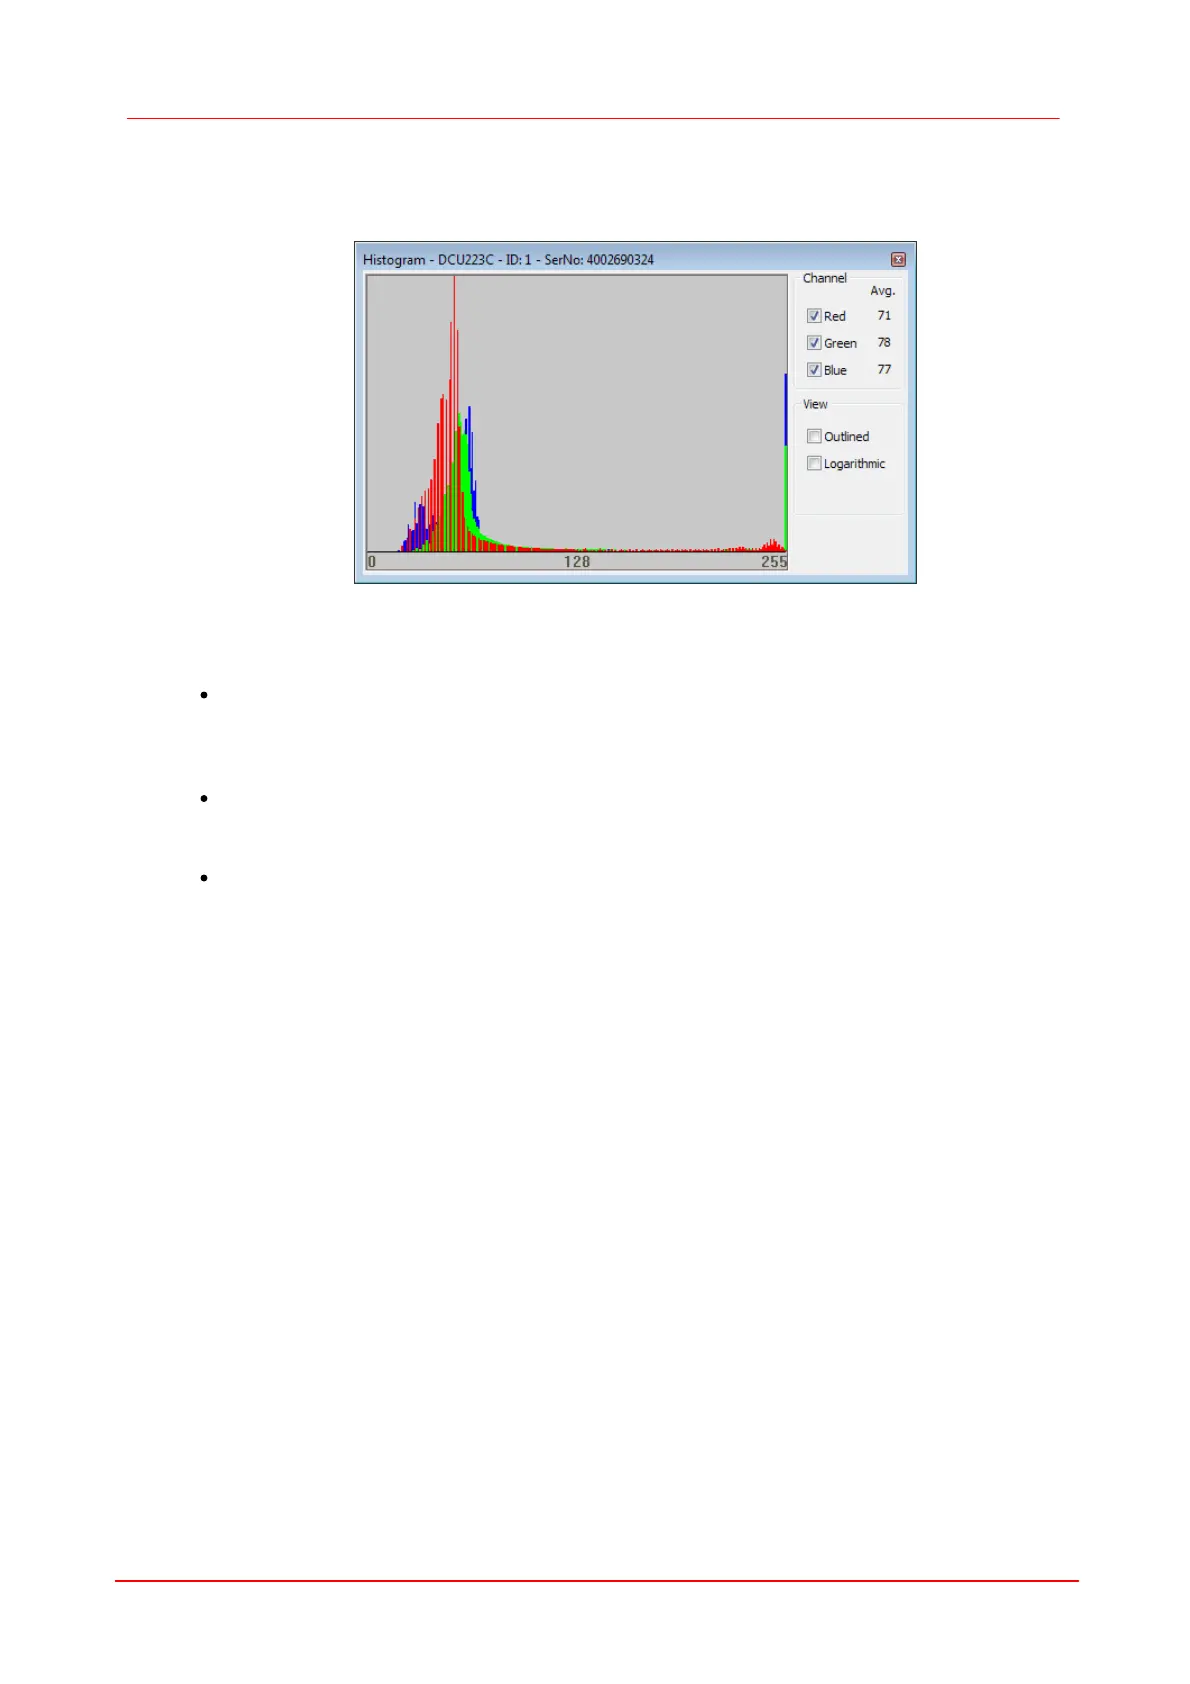
Figure 33: Menu View – Histogram
The histogram shows the frequency distribution of the color values of an image. Following options
are available:
Channel
With the options Red, Green and Blue can the display of the respective color channels be
switched on and/or off. With Avg. the average value of the individual color value is displayed.
In operating mode mono the average grey value is displayed.
Outlined
With the option Outlined the display of the color values can be switched between area and line
diagram.
Logarithmic
With the activation of this option the representation takes place with a logarithmic scaling.
 Loading...