35
CHART FUNCTIONS UNIQUE TO THE MC-4S
5 You can change the prism amount by using the dial of the KB-50S.
In the "Simulation" mode, the prism movable range is 6.0
BI to 6.0
BO for horizontal prism and,
4.4
BD to 4.4
BU for vertical prism.
Turn the dial, and the target moves according to "Dial Navigation".
6 To finish "Simulation", touch the [Simulate] button again.
The chart of the MC-4S is returned to the display status before executing "Simulation".
The prism lens on the measuring head of the CV-5000 is set according to the current prism
value.
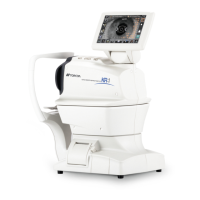
Aniseikonia simulation function
By using the aniseikona simulation function, the target size at the left side of the vertical aniseikonia
chart can be changed in stages and, under this changed status, the chart can be displayed.
Relevant chart
The following chart is applicable to this function:
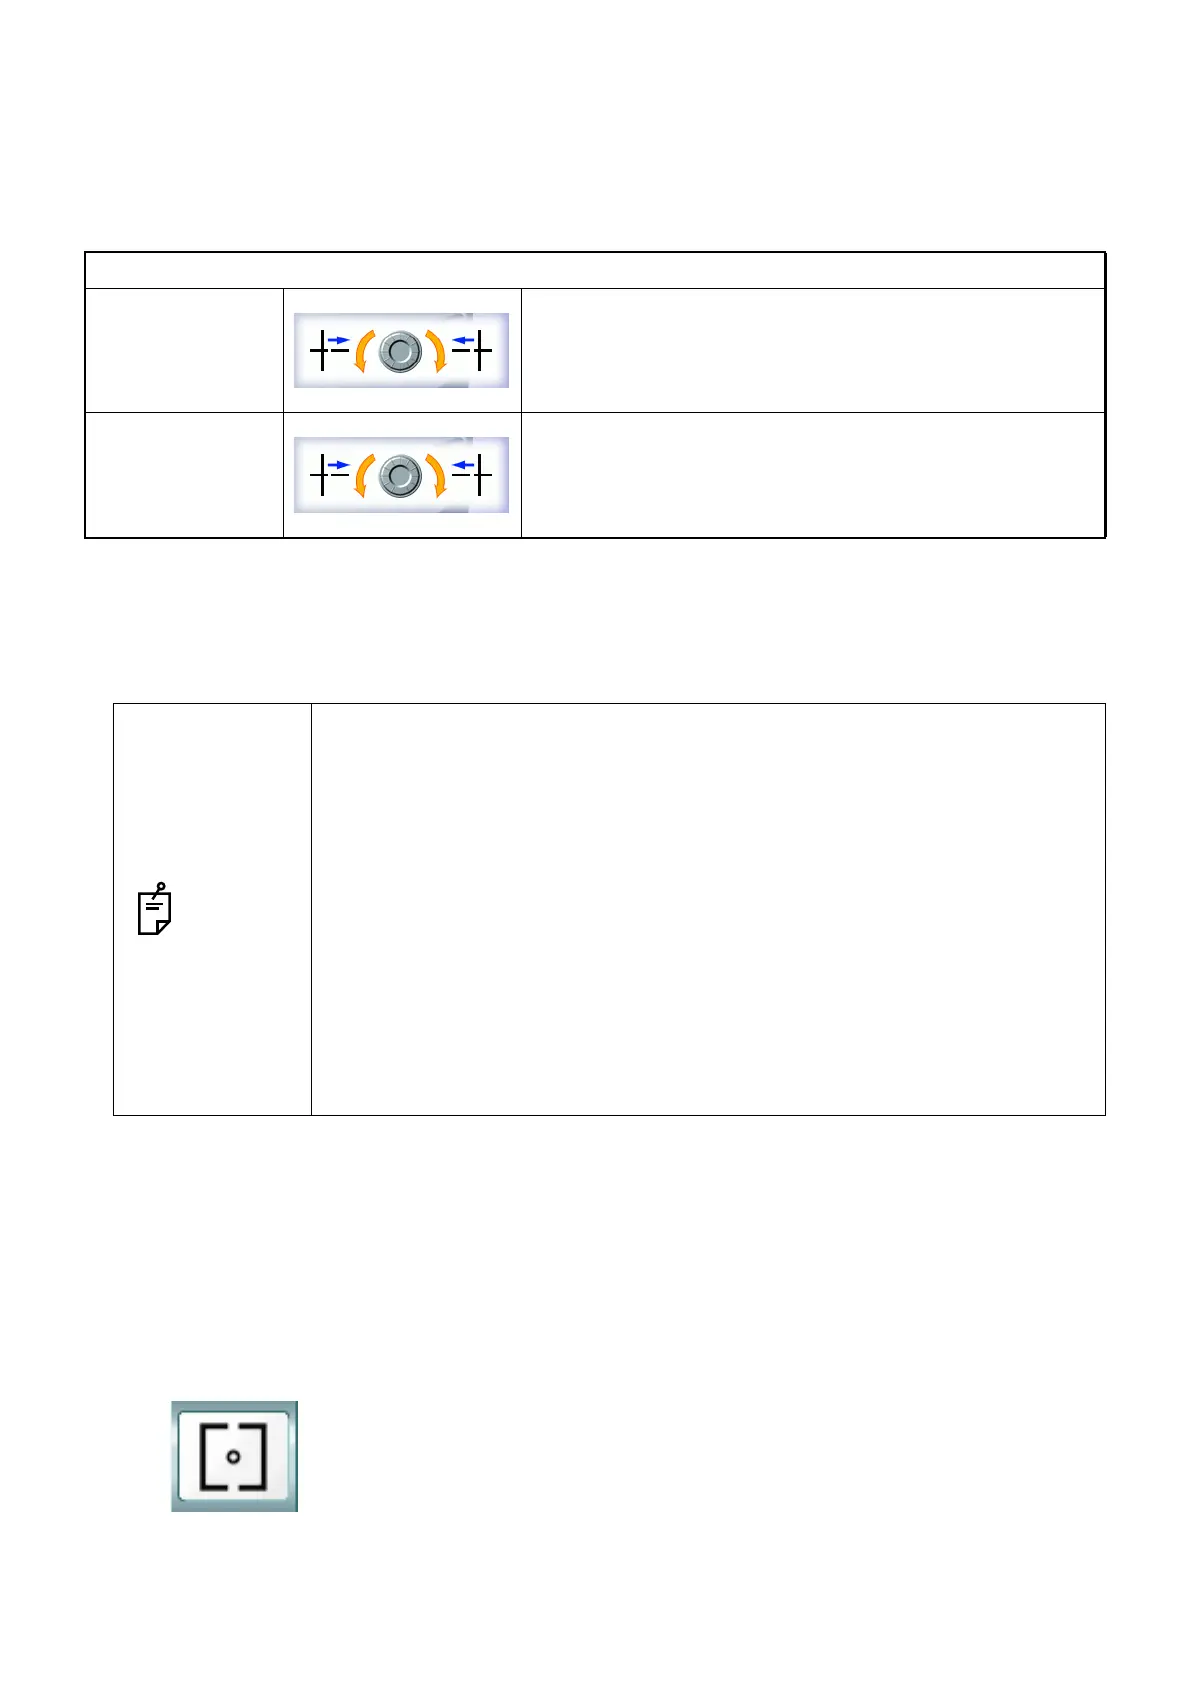
Example of "Dial Navigation" for cross chart
Horizontal phoria
measurement
Turn the dial clockwise, and the vertical line moves left
and the horizontal line moves right.
Turn the dial counterclockwise, and the vertical line
moves right and the horizontal line moves left.
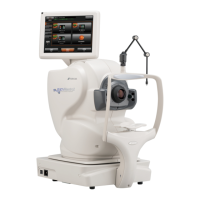
Vertical phoria
measurement
Turn the dial clockwise, and the vertical line moves down
and the horizontal line moves up.
Turn the dial counterclockwise, and the vertical line
moves up and the horizontal line moves down.
NOTES
• When operating through a mouse/personal computer, do not turn the dial but
click the button on the control window. Operate according to "Mouse Naviga-
tion".
• The "Simulation" mode cannot be executed in the following case: The preset
prism value before accessing the "Simulation" mode is beyond the prism mov-
able range of the "Simulation" mode.
• When executing the "Simulation" mode with the cross ring chart, the prism
movable range is 6.0
BI to 6.0
BO for horizontal prism and 4.4
BD to
4.4
BU for vertical prism. The range where the targets are within the chart
screen is 1.4
BI to 1.4
BO for horizontal prism and 1.0
BD to 1.0
BU for ver-
tical prism. If you set the prism value exceeding this range, the right eye tar-
get moves to the outside of the chart because of the chart shape
characteristics.
• When changing to other charts, the "Simulation" mode is also exited.