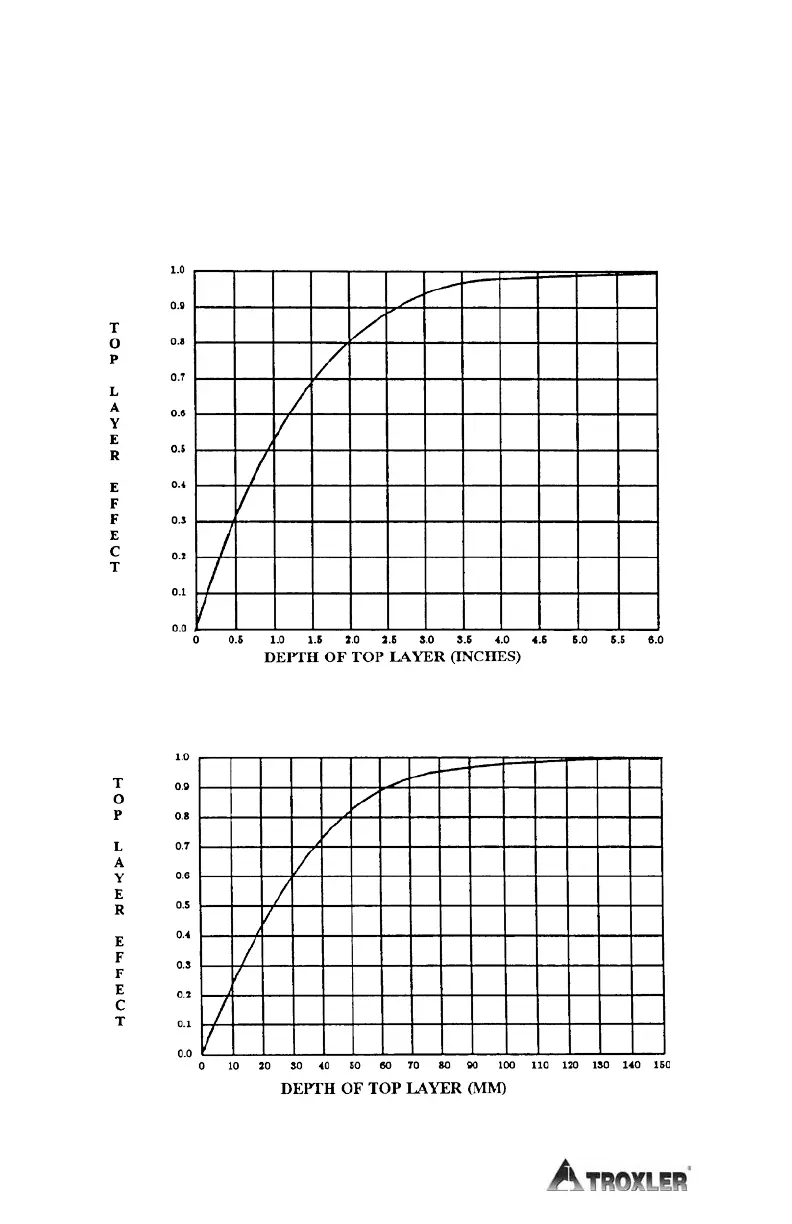
A normalized curve showing the percentages of photons at the detectors for
various depths is shown in Figure A–3. These curves can be used to
compute the gauge response to layered materials of different densities. As
an example, for a 20-mm thick material with a density of 2000 kg/m
3
overlaying a material with a density of 2150 kg/m
3
, the gauge
measurement will indicate a density of 2089 kg/m
3
[(2000 x 0.41) + (2150
x 0.59)].
Figure A–3. Depth of Top Layer