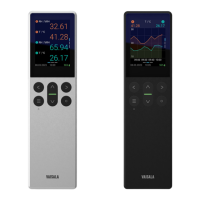
3.4 Graph view
Each measurement view (excluding the parameter list view) has a graph view associated to it.
The graph view shows you the measurements as a curve. From the curve you can examine the
data trend and history. To open the graph view, press while in the measurement view.
Figure 7 Graph views in Indigo80
You can zoom in and out in the graph and move back and forward on the timeline:
• To enable moving on the graph, press the
button
• To zoom in and out, press the
and buttons
• To move back and forward on the timeline, use the and buttons
• To exit the zoom functionality, press the
button.
3.5
Devices menu
In the Devices menu of Indigo80 you can see all devices connected to Indigo80. The menu
contains calibration and adjustment options for connected devices, as well as device-specific
settings. Note that all settings related to the indicator itself are located in the Indigo80 menu
(see Indigo80 menu (page 27)).
Figure 8 Devices menu in Indigo80 main menu
Chapter 3 – Indigo80 menus and views
21