Table 4-6: Prism Calculation Results
Readings at the selected location
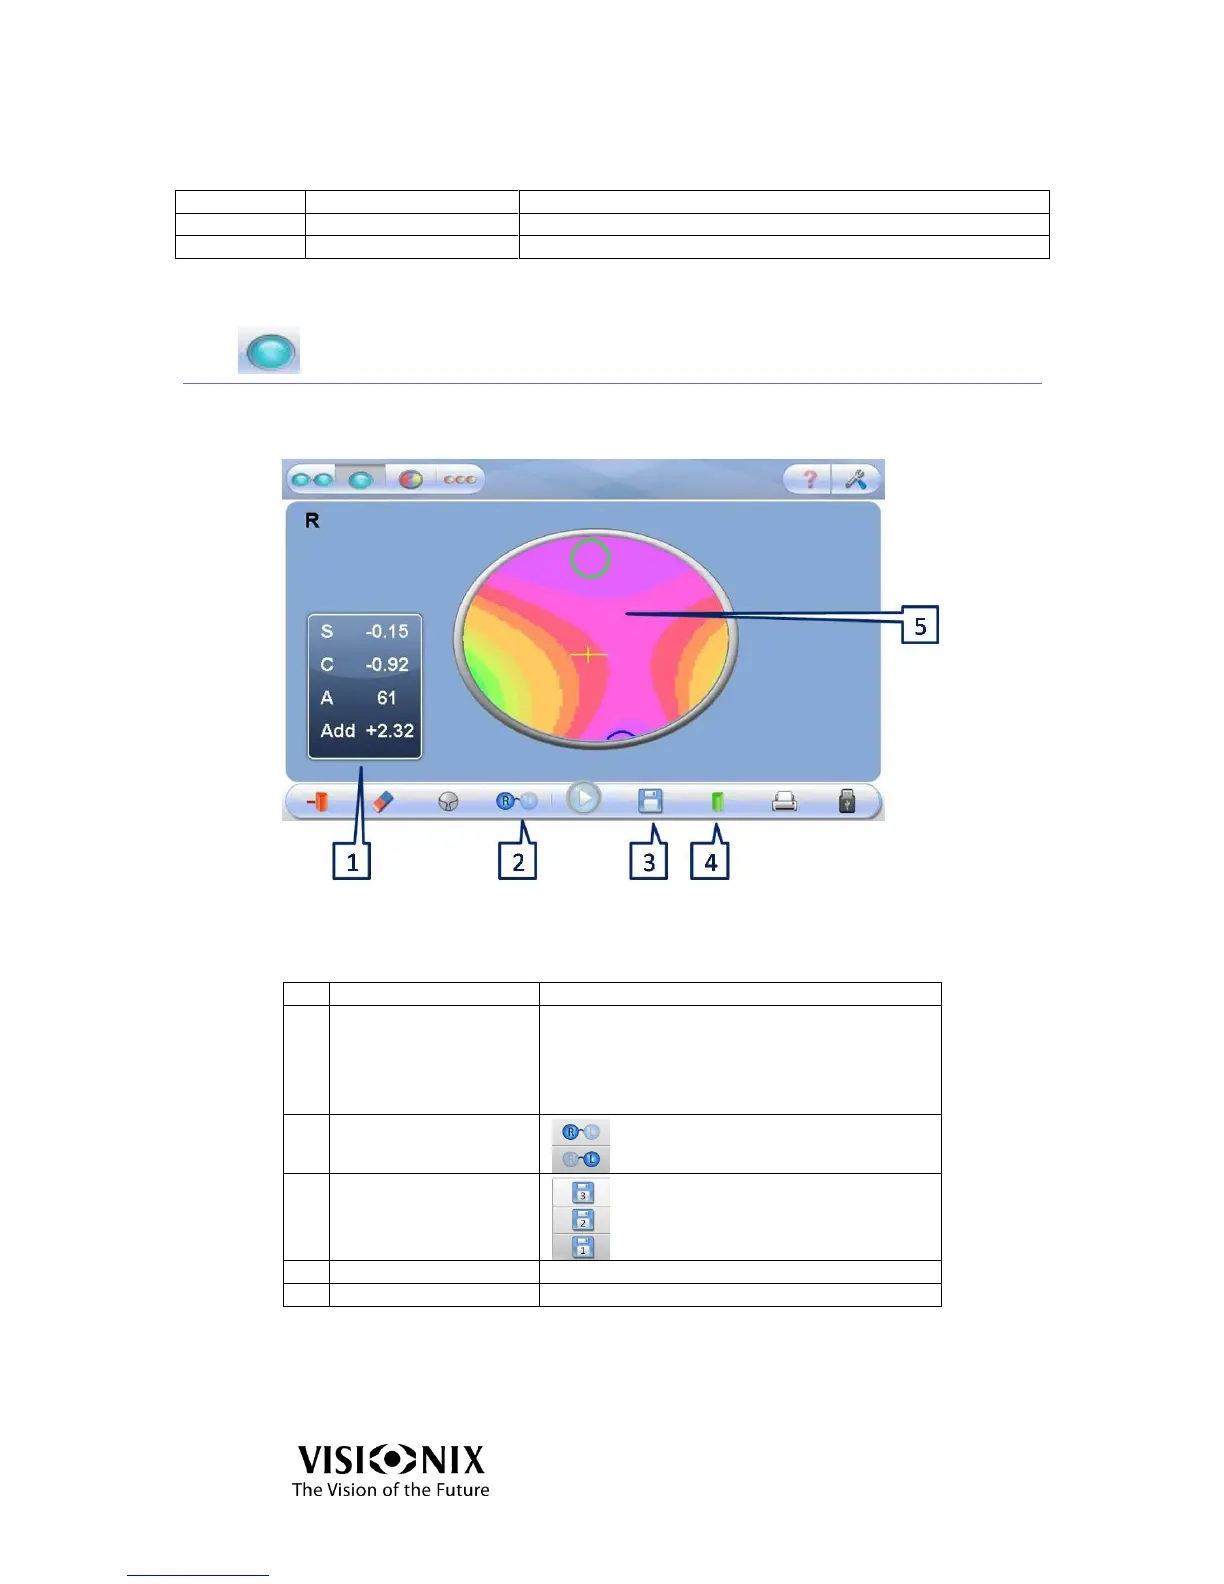
4.3 Analyze Interface
This interface is used to analyze the lens properties at any given point of a
preselected lens.
Figure 4-5: Analyze Interface
Table 4-7: Analysis Screen Elements
Readout is printable:
S: sphere
C: cylinder
A: Axis
Add: add power between far and near vision
Save the measurement to compare
with another one. If there is a saved
measurement, the memory icon will
be yellow on the lower toolbar.
Sphere \ Cylinder \ Prism
Display of the map of powers
In Analyze mode, the blue curve presents the near vision and the green one the far
vision. The cross represents the optical center of the lens.