Wireless Array
Viewing Status on the Wireless Array 129
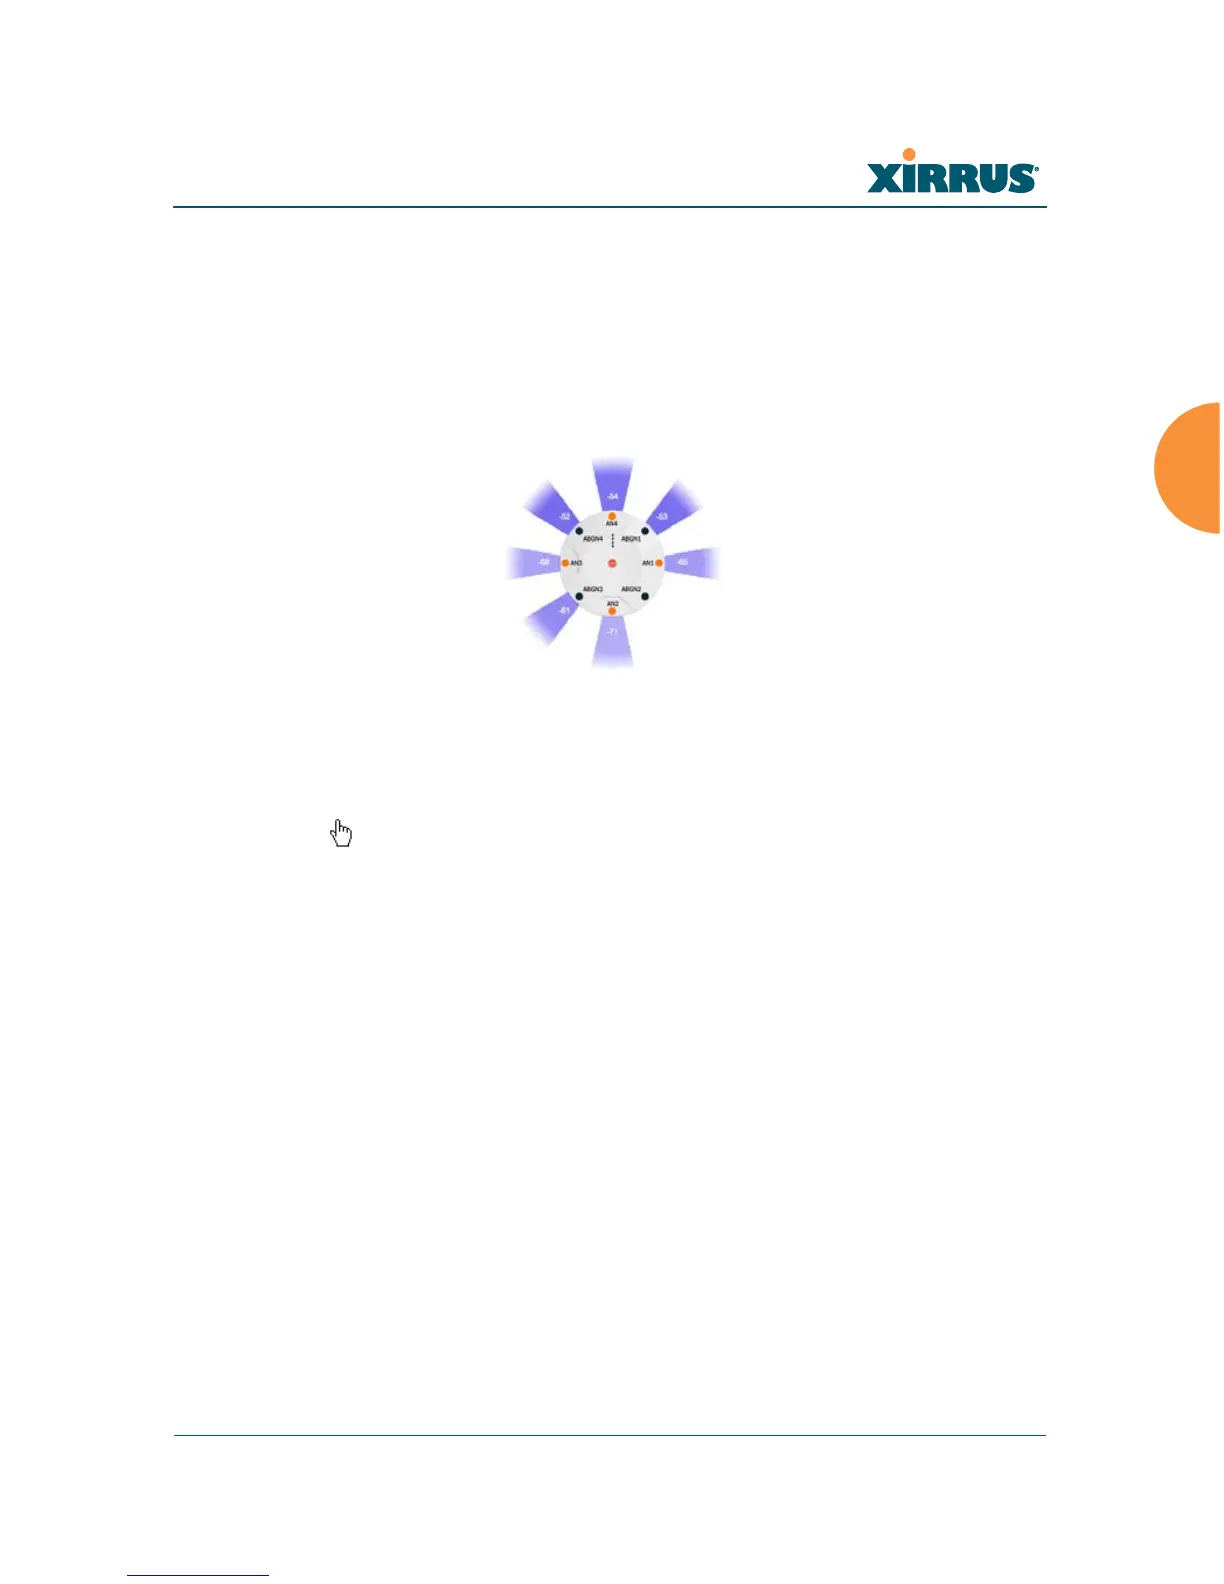
By default, the RSSI is displayed numerically. You may display the relative
strength using color if you select Colorize Intensity, with the strongest signals
indicated by the most intense color. (Figure 71) If you select Graph, then the RSSI
is shown on a representation of the Array, either colorized or numerically based
on your selection. (Figure 72) The stations are listed to the left of the Array — click
on a station to show its RSSI values on the Array.
Figure 72. Station RSSI Values — Colorized Graphical View
In either graphical or tabular view, you may sort the rows based on any column
that has an active column header, indicated when the mouse pointer changes to
the hand icon . Click on the Refresh button to refresh the station list, or click in
the Auto Refresh check box to instruct the Array to refresh this window
automatically.
See Also
Station Status Windows
RF Monitor Windows

 Loading...