Wireless Array
130 Viewing Status on the Wireless Array
Signal-to-Noise Ratio (SNR)
For each station that is associated to the Array, the Signal-to-Noise Ratio (SNR)
window shows the station’s SNR value as measured by each IAP. In other words,
the window shows the SNR of the station’s signal at each IAP radio. The signal-
to-noise ratio can be very useful for determining the cause of poor performance at
a station. A low value means that action may need to be taken to reduce sources of
noise in the environment and/or improve the signal from the station.
Figure 73. Station Signal-to-Noise Ratio Values
You may choose to display Unassociated Stations as well with a checkbox at the
bottom of the window.
By default, the SNR is displayed numerically. (Figure 73) You may display
the relative value using color if you select Colorize Intensity, with the highest
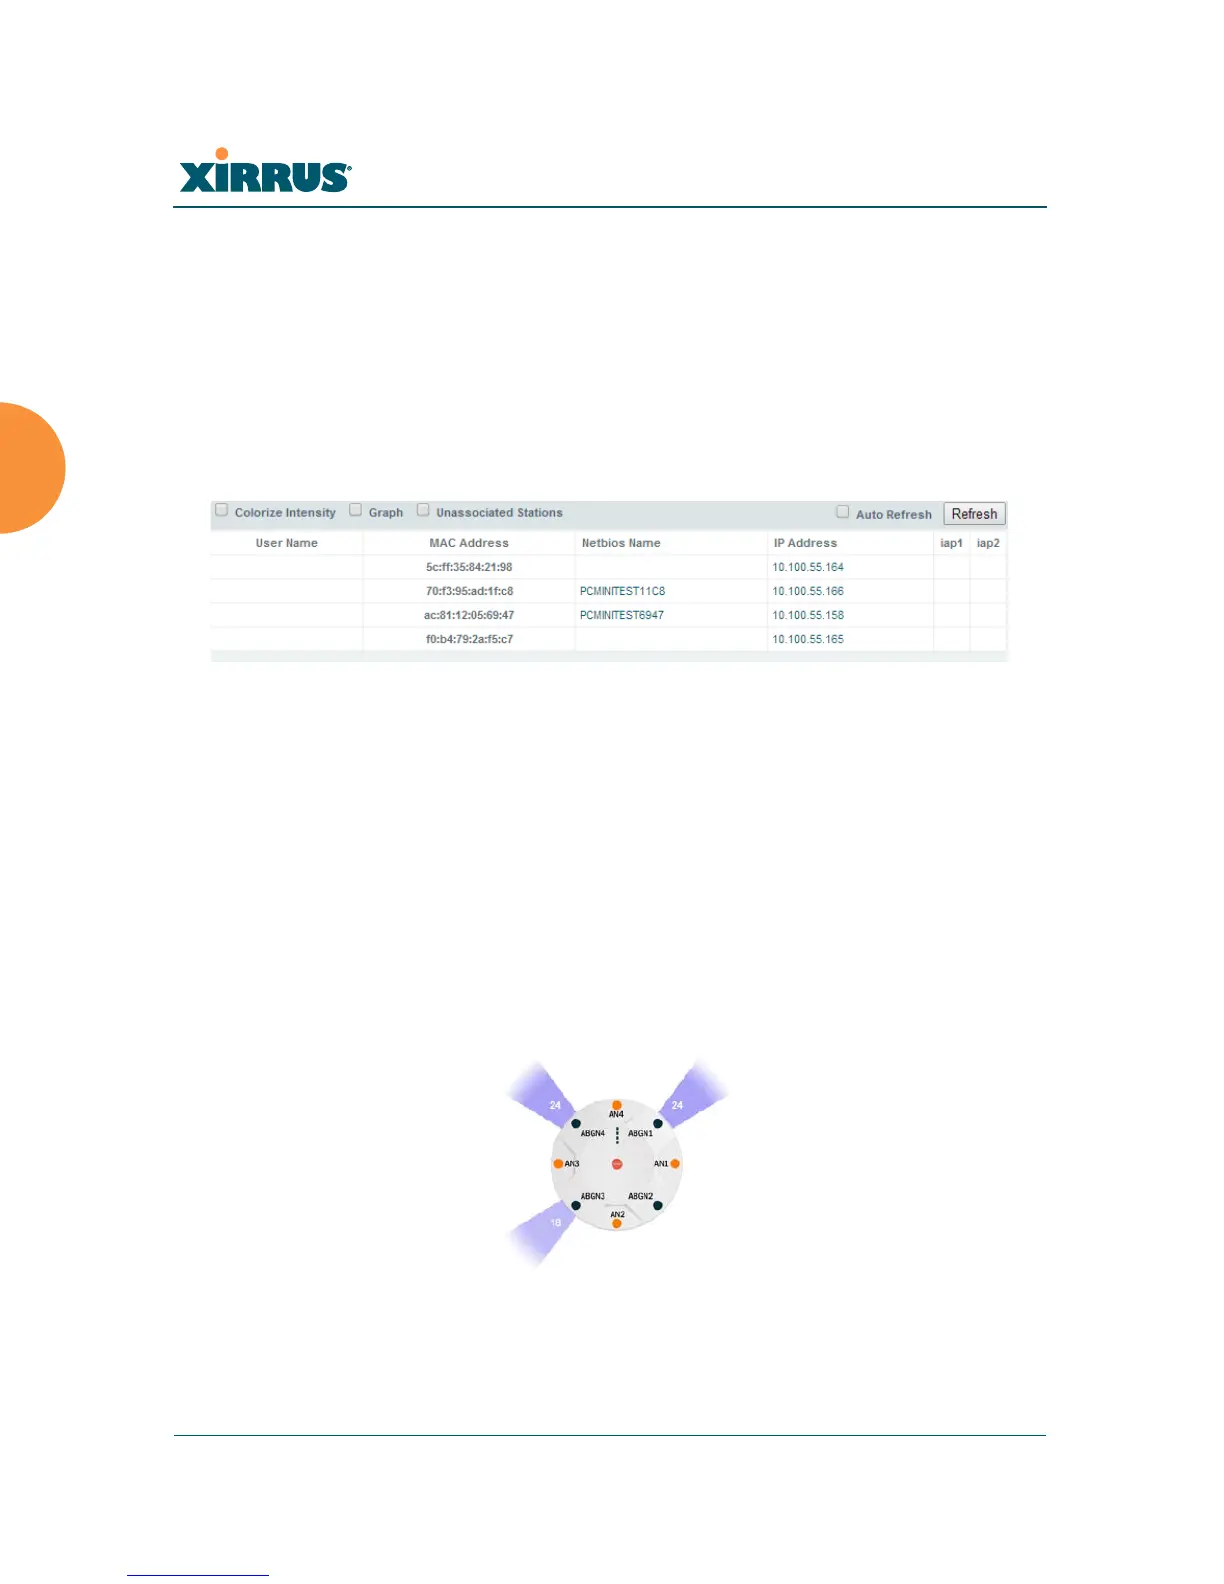
SNR indicated by the most intense color. (Figure 74) If you select Graph, then
the SNR is shown on a representation of the Array, either colorized or
numerically based on your selection. The stations are listed to the left of
the Array — click on a station to show its SNR values on the Array.
Figure 74. Station SNR Values — Colorized Graphical View
In either graphical or tabular view, you may sort the rows based on any column
that has an active column header, indicated when the mouse pointer changes to
 Loading...