Chapter 6 Settings
43
Osmo1® Single-Sample Micro-Osmometer User Guide
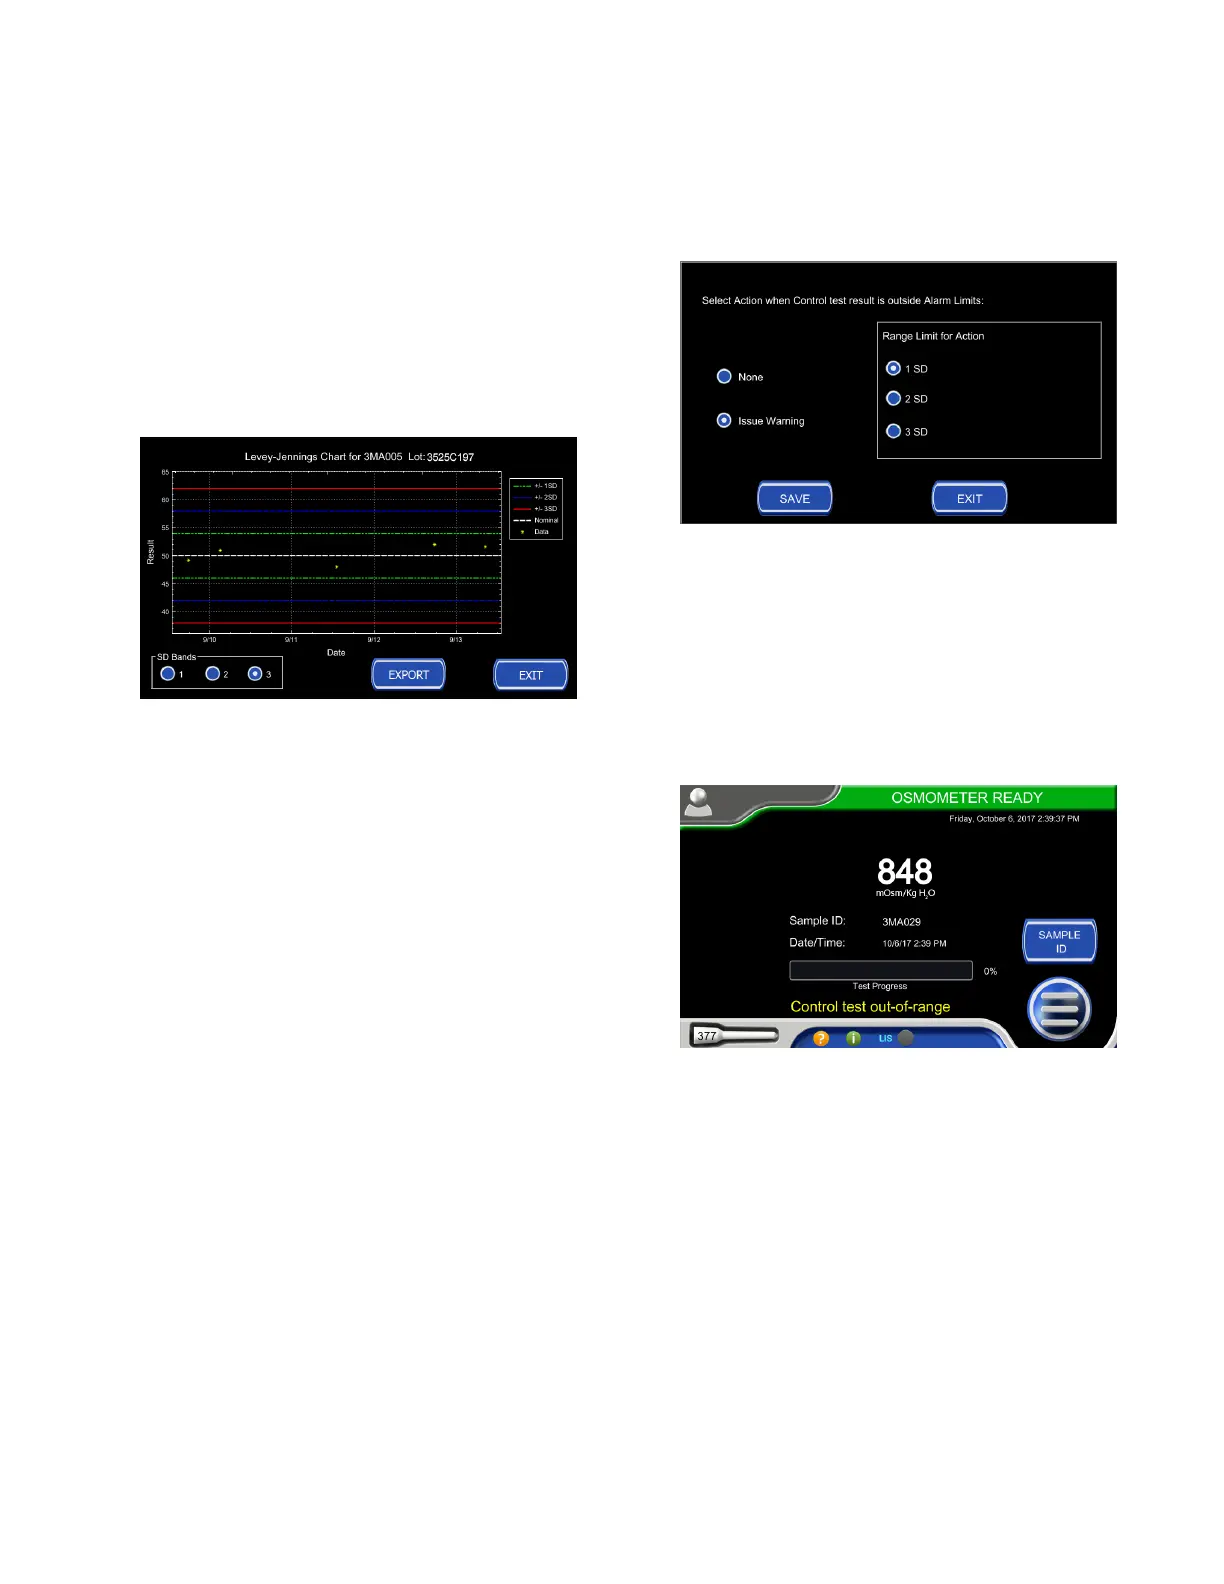
Displaying a Levey-Jennings chart
The Osmo1 can generate Levey-Jennings charts for
controls with Standard Deviation (SD) bands.
1. From the Controls screen, select a control; then tap
Chart.
The Levey-Jennings chart is displayed (Figure 56).
Figure 56: Levey-Jennings chart
2. If desired, tap the Export button to export the Levey-
Jennings chart to a USB drive.
3. When you have finished viewing (and/or exporting)
the chart, tap Exit to close the chart and return to
the Controls screen.
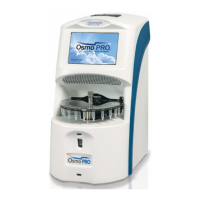
Adding an action to a control
A user with supervisor-level access can configure the
system to issue a warning when any sample result is
outside the control limits.
NOTE: This action functions only if you use Sample IDs
during testing.
1. From the Controls screen, select a control; then tap
Action.
The Action Setup screen displays (Figure 57).
Figure 57: Control outside boundary Action screen
2. Select Issue Warning; then select the range limit for
the action (either 1, 2, or 3 standard deviations).
3. Tap Save to save the action setup.
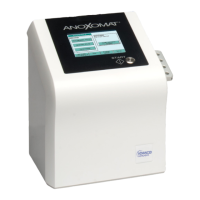
The system will now issue a warning if a sample
result falls outside the range limit you defined.
Figure 58 shows an example of a warning message.
Figure 58: Example of a warning message
6.11 Setting up LIS communication
If your lab uses a Laboratory Information System (LIS),
you can configure the Osmo1 to communicate with it.
The Osmo1 can either function in a server or client mode
with LIS; communication can be set to uni-directional or
bi-directional. See Appendix E for more information.