20
CHARTS MENU
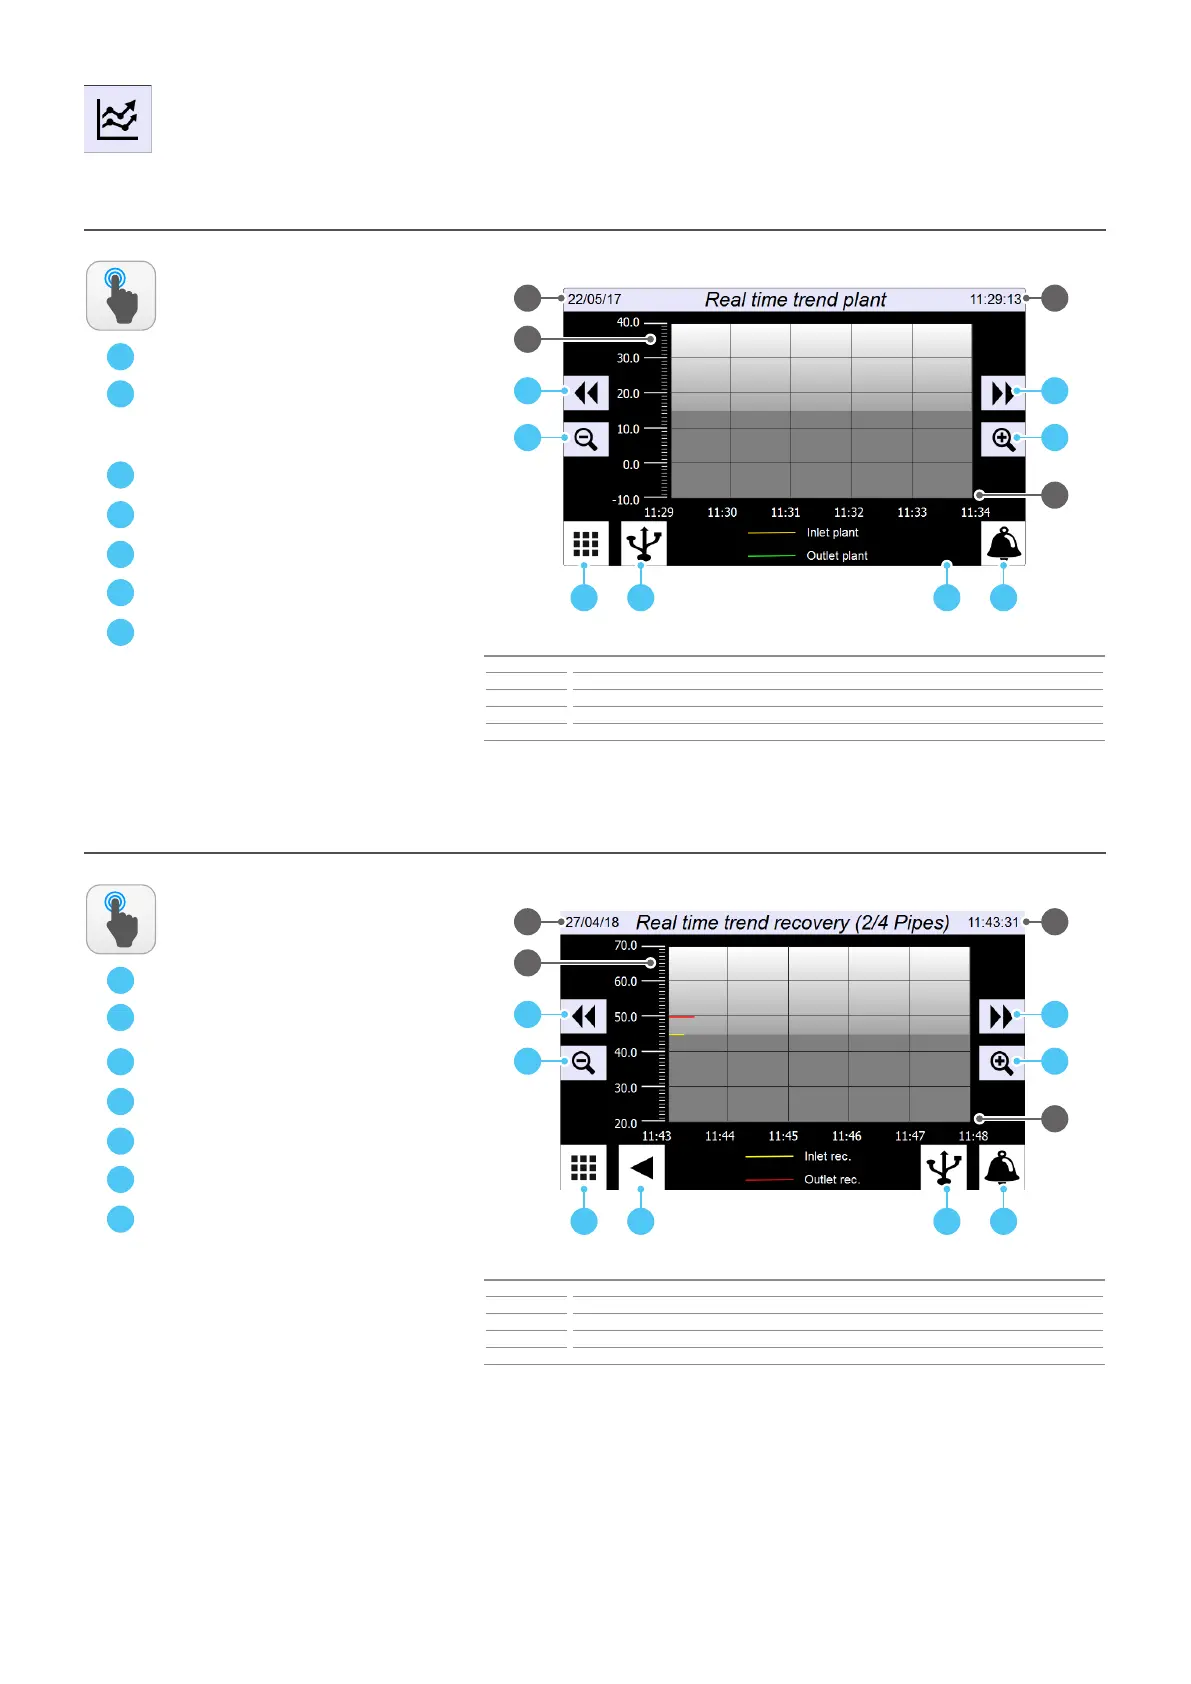
CHARTS - Displays real-me charts of the values read by the system side probes
A
B
C
Index Meaning
1 Indicates today’s date
2 Indicates the current time
3 The Y axis indicates the temperature (°C)
4 The Y axis indicates the time to which to refer the temperature data read by the probes
ACTIONS
AVAILABLE:
D
E
F
CHARTS - Display charts in real me regarding values read by the 2/4-pipe system recovery side probes (visible if mulpurpose units are present)
A
B
C
Index Meaning
1 Indicates today’s date
2 Indicates the current time
3 The Y axis indicates the temperature (°C)
4 The Y axis indicates the time to which to refer the temperature data read by the probes
ACTIONS
AVAILABLE:
D
E
F
G
1
A C
2
3
4
B
D
F
E
G
G
G
1
A C
2
3
4
B
D
F
E
G
G