5-36 Agilent 4155B/4156B User’s Guide Vol.2, Edition 5
Analyzing Measurement Results
Automatic Analysis
Example
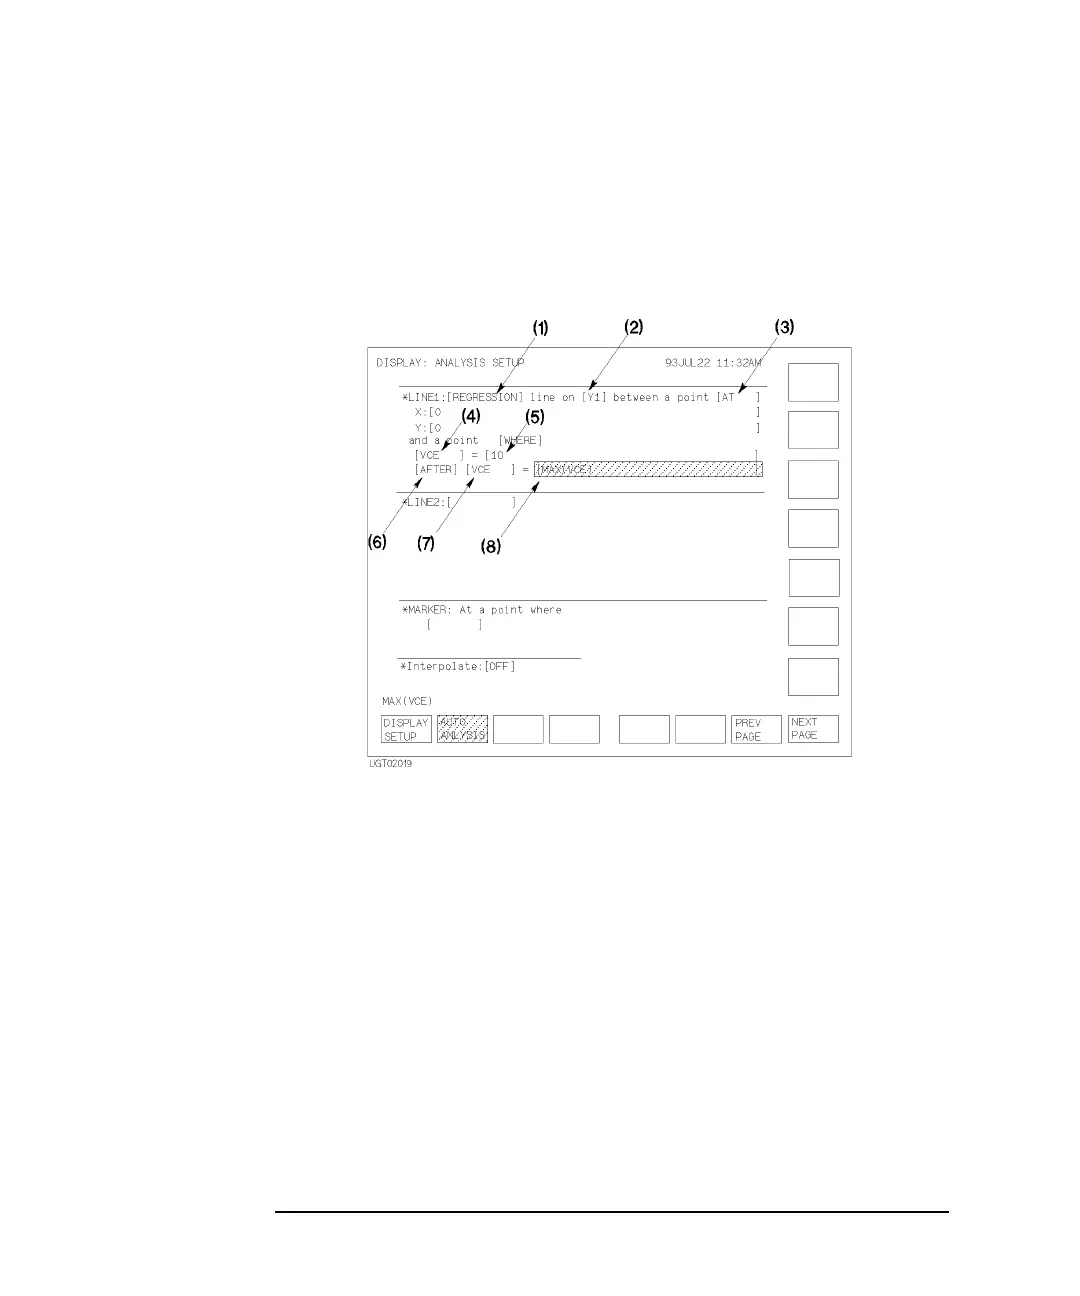
The following figure shows an example setup to automatically draw a regression
line. The range for the regression calculation is specified by two points. One point is
specified by X-Y coordinate mode and other point is specified by data condition
mode.