76 Chapter2
Making Measurements
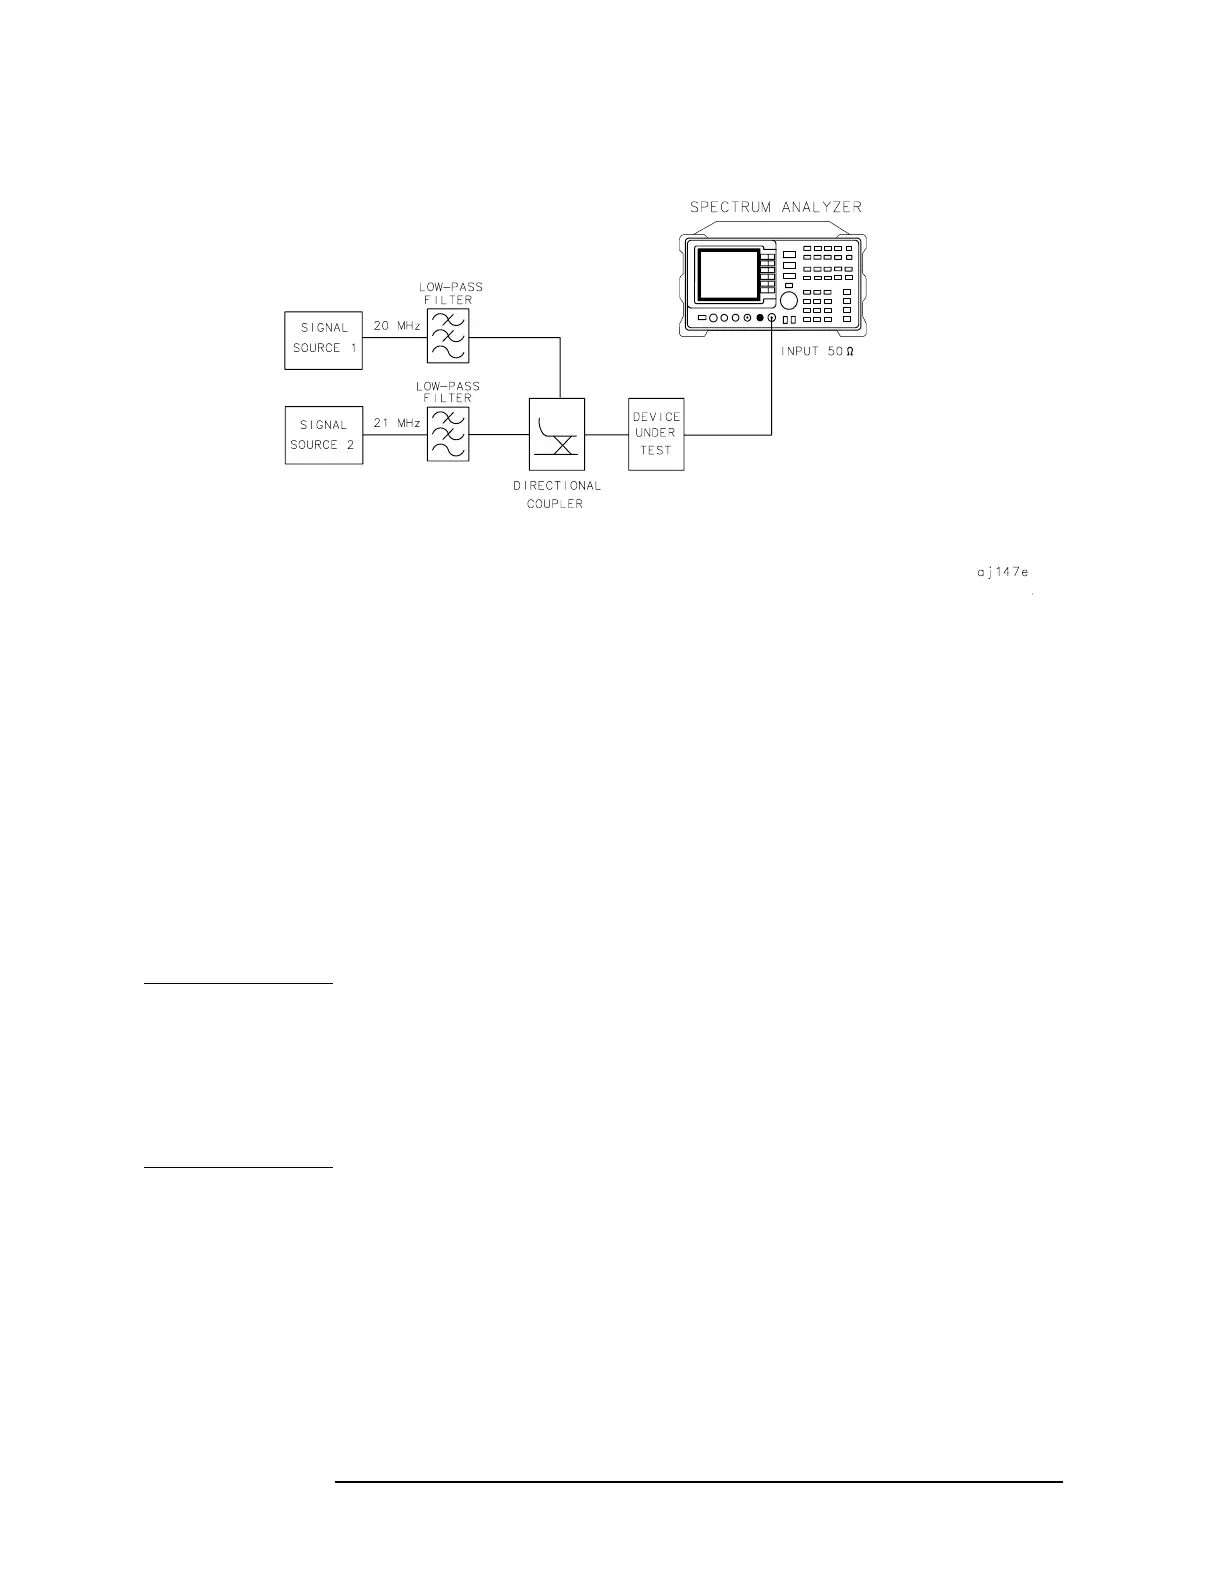
Example 5: Third-Order Intermodulation Distortion
Figure 2-21 Third-Order Intermodulation Test Setup
2. Set one source to 20 MHz and the other source to 21 MHz, for a
frequency separation of 1 MHz.
3. Set the sources equal in amplitude (for this example, we have set the
sources to −30 dBm).
Reduce the frequency span
4. Tune both signals onto the display by setting the center frequency to
20.5 MHz.
5. Reduce the frequency span to 5 MHz for a span wide enough to
include the distortion products on the display. For frequency
separations other than those used in this example, choose a span
greater than three times the separation of the source signals.
NOTE A quick way to get to a smaller frequency span is to use SPAN ZOOM.
SPAN ZOOM activates a highest-peak marker, turns signal track on, and
zooms down to the span selected by the user.
To activate the span zoom function, press SPAN, SPAN ZOOM, and enter
5 MHz. Be sure to turn signal track off before changing other spectrum
analyzer settings.
Center and adjust the signals on the display
6. Press
FREQUENCY.
7. Using the knob, center the two signals on the display, as shown in
Figure 2-22 on page 77.
 Loading...

