112 Agilent InfinityLab LC Series 1260 Infinity II FLD User Manual
5
Optimizing the Detector
Example: Optimization for Multiple Compounds
5 Wait until the baseline stabilizes. Start the run.
6 Load the signal.
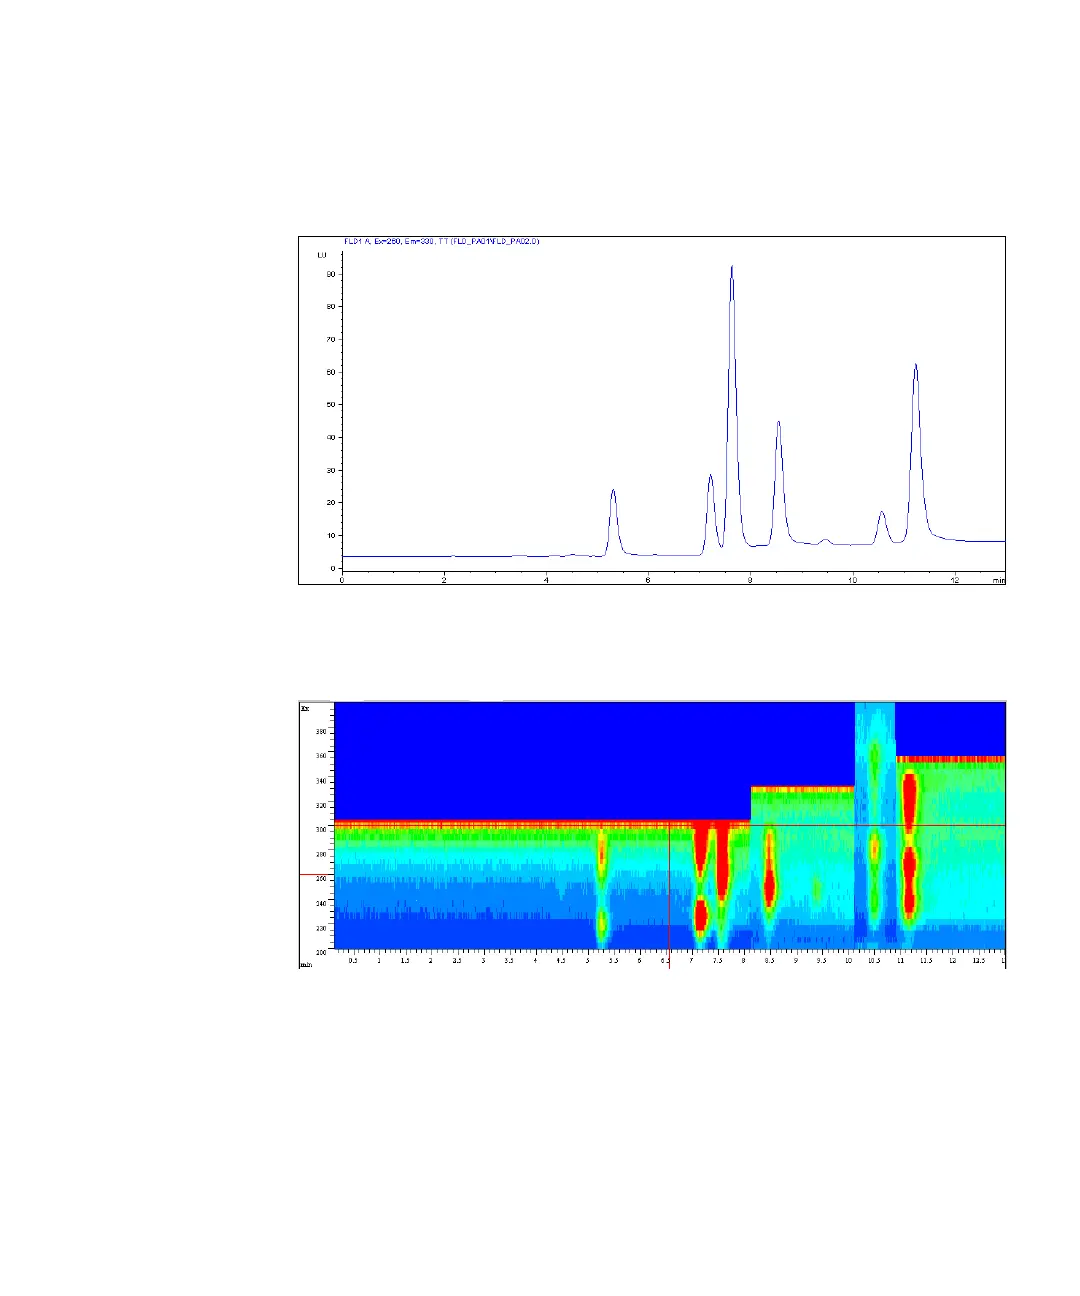
Figure 41 Chromatogram - Excitation Scan at Reference Wavelength 260/330 nm
7 Use the isoabsorbance plot and evaluate the optimal excitation wavelengths
(in this example just in the time range of 13 minutes).
Figure 42 Isoabsorbance Plot - Excitation
The table below shows the complete information about emission (from
Figure 39 on page 110) and excitation maxima.
 Loading...