19
Navigating and Customizing Your Flow Controller
Collecting Live Flow Data
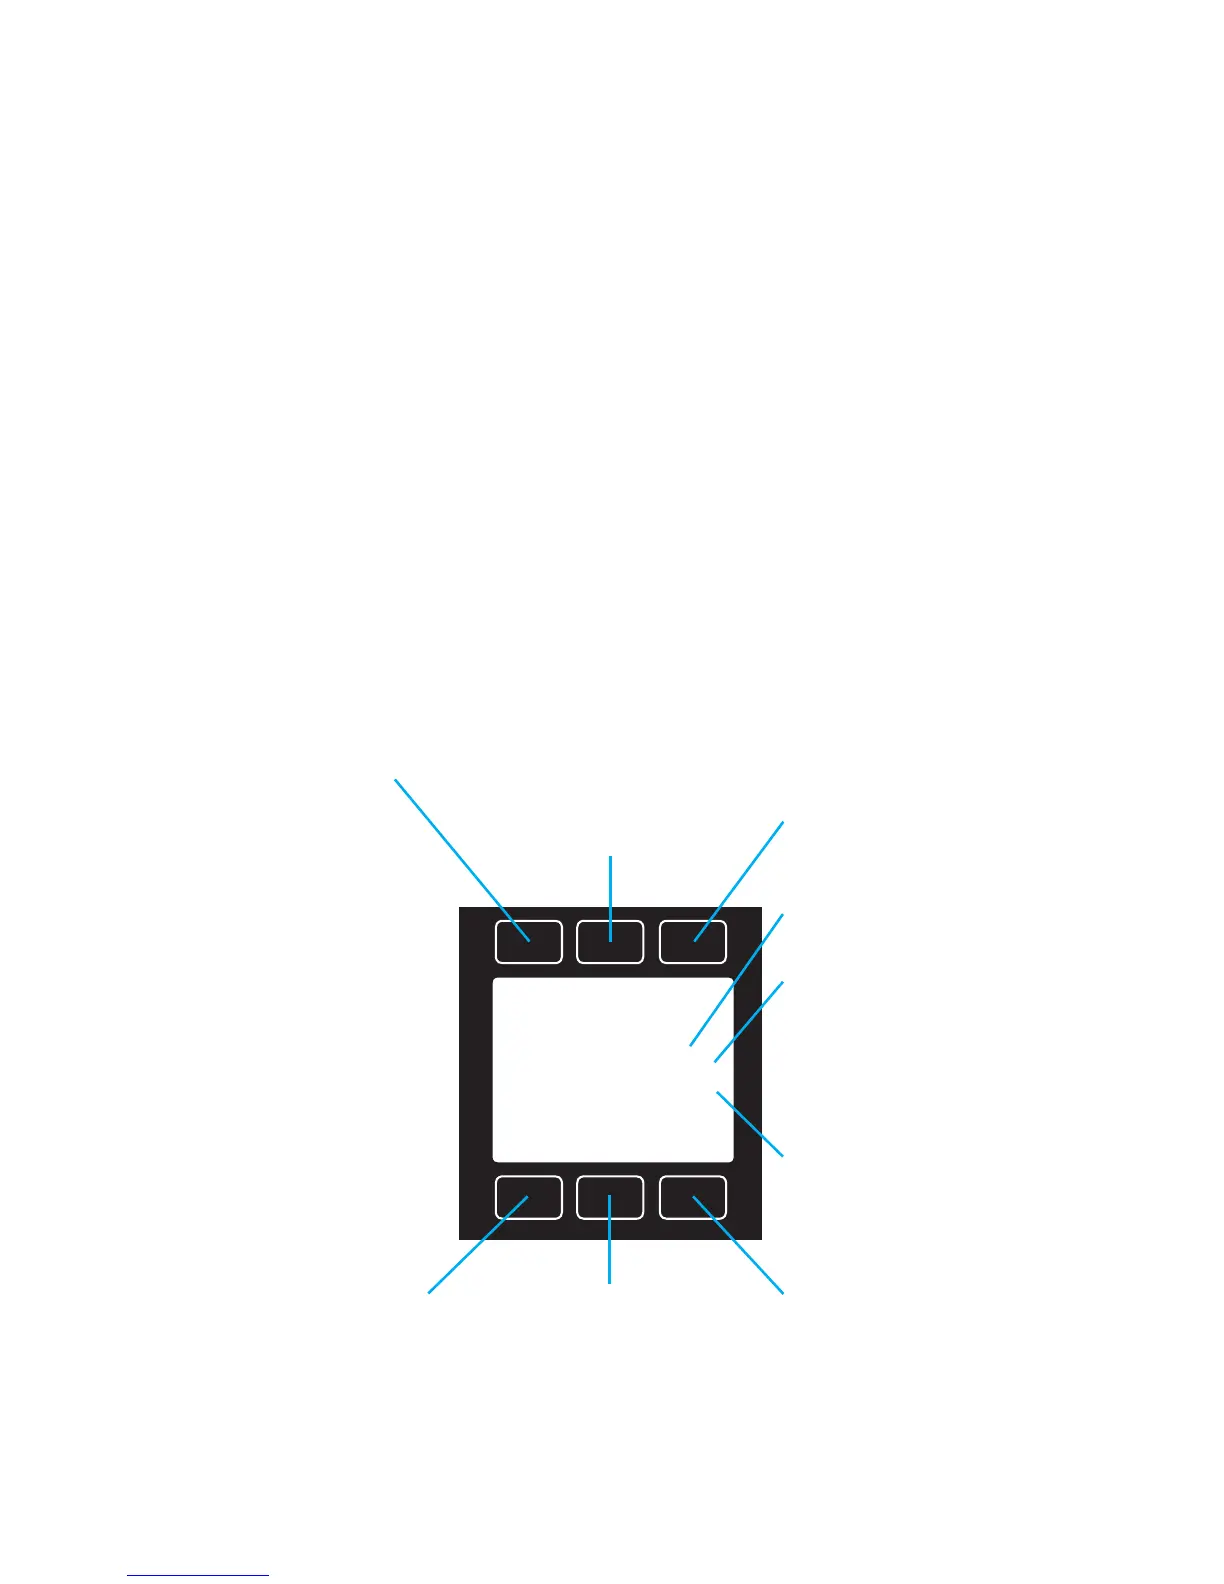
The Main Display has three primary functions:
• Collecting live temperature, pressure and ow data (see below)
• Changing engineering units for temperature, pressure and ow (page 20)
• Changing the ow or pressure control setpoint (page 26)
This screen displays live data for all ow parameters simultaneously. Live
data is measured 1000 times every second but refreshed more slowly on the
display. Press the button above or below any of the four ow parameters once
to highlight its value in the center of the screen. Press the same button again
to enter the engineering unit selection menu for that parameter (page 20).
Main Display
Flow Temp
+24.38
#C
SLPM
Air
Mass Flow
+15.44
TOTAL/
MENU
+15.44
SLPM
+16.7
LPM
SETPT
+15.44
#C
+24.38
PSIA
+13.60
TOTAL Accesses the optional
ow totalizer (page 21).
MENU Enters the Menu system
(page 24).
SETPT Sets the ow or pressure
control setpoint (page 26).
Engineering unit for the
highlighted parameter.
Status messages will display
here (see page 8).
Selected gas calibration
(page 31).
Mass Flow
+15.44
SLPM
Highlights mass ow rate
in the center:
Volu Flow
+16.67
LPM
Highlights volumetric (actual)
ow rate in the center:
Highlights temperature in
the center:
Highlights pressure in
the center. Push a second
time to choose pressure
parameter:
Abs Press
+13.60
PSIA
Internal absolute pressure:
Gage Press
-0.12
PSIG
Internal gauge pressure:
(not available on all devices):
Baro Press
+13.72
PSIA
Barometric pressure
(not available on all devices):

 Loading...