Chapter 5 Analyze the Experiment
View the Amplification Plot
Applied Biosystems 7500/7500 Fast Real-Time PCR System Getting Started Guide for Standard Curve
Experiments
80
Notes
If your experiment does not meet the guidelines above:
• Omit wells (see “Omit Wells from the Analysis” on page 90).
or
• Manually adjust the baseline and/or threshold (see “View the Analysis Settings” on
page 86).
For More
Information
For more information on the Amplification Plot screen, open the 7500 Software Help by
clicking or pressing F1.
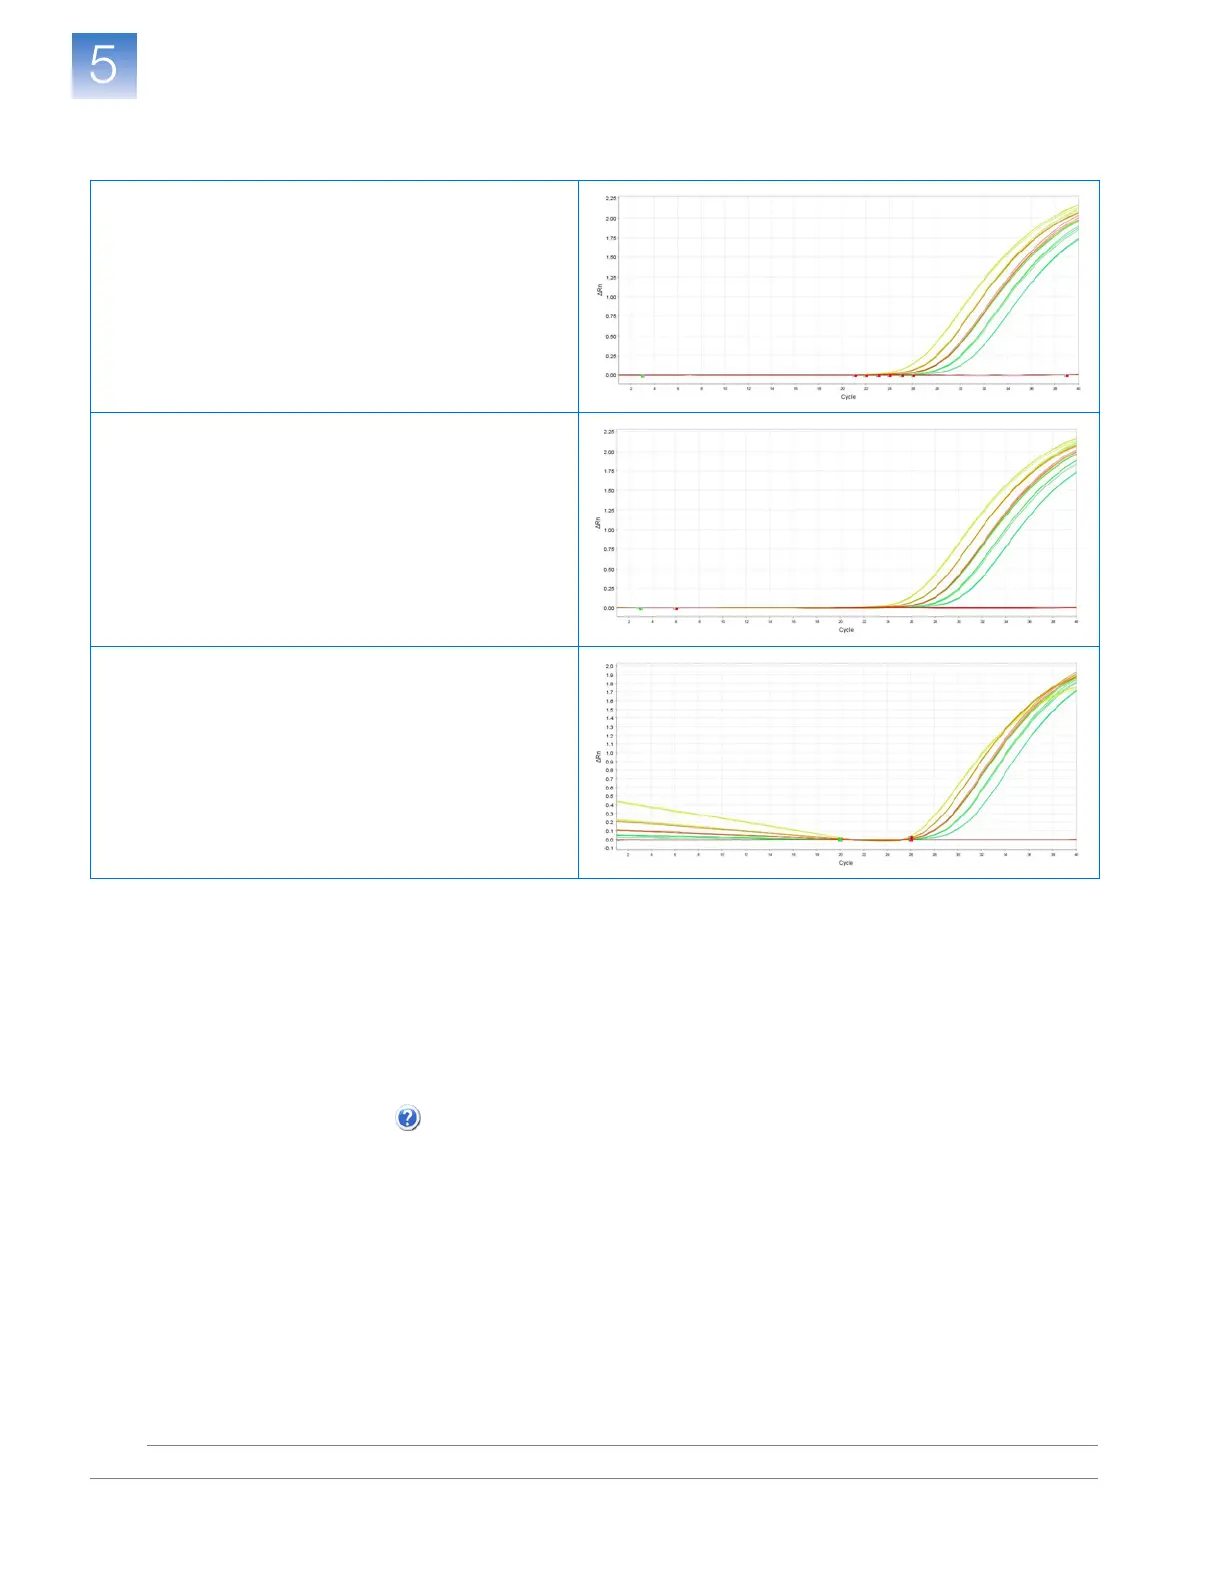
Baseline Examples
Baseline Set Correctly
The amplification curve begins after the maximum
baseline.
Baseline Set Too Low
The amplification curve begins too far to the right of the
maximum baseline. Increase the End Cycle value.
Baseline Set Too High
The amplification curve begins before the maximum
baseline. Decrease the End Cycle value.
 Loading...


