Chapter 5 Analyze the Experiment
Omit Wells from the Analysis
Applied Biosystems 7500/7500 Fast Real-Time PCR System Getting Started Guide for Standard Curve
Experiments
90
Notes
Omit Wells from the Analysis
Experimental error may cause some wells to be amplified insufficiently or not at all.
These wells typically produce C
T
values that differ significantly from the average for the
associated replicate wells. If included in the calculations, these outliers can result in
erroneous measurements. To ensure precision, omit the outliers from the analysis.
About the
Example
Experiment
In the standard curve example experiment, well B12 is flagged as a potential outlier.
Omit Wells
1. In the navigation pane, select Analysis Amplification Plot.
Note: If no data are displayed, click Analyze.
2. In the Amplification Plot screen, select C
T
vs Well in the Plot Type drop-down list.
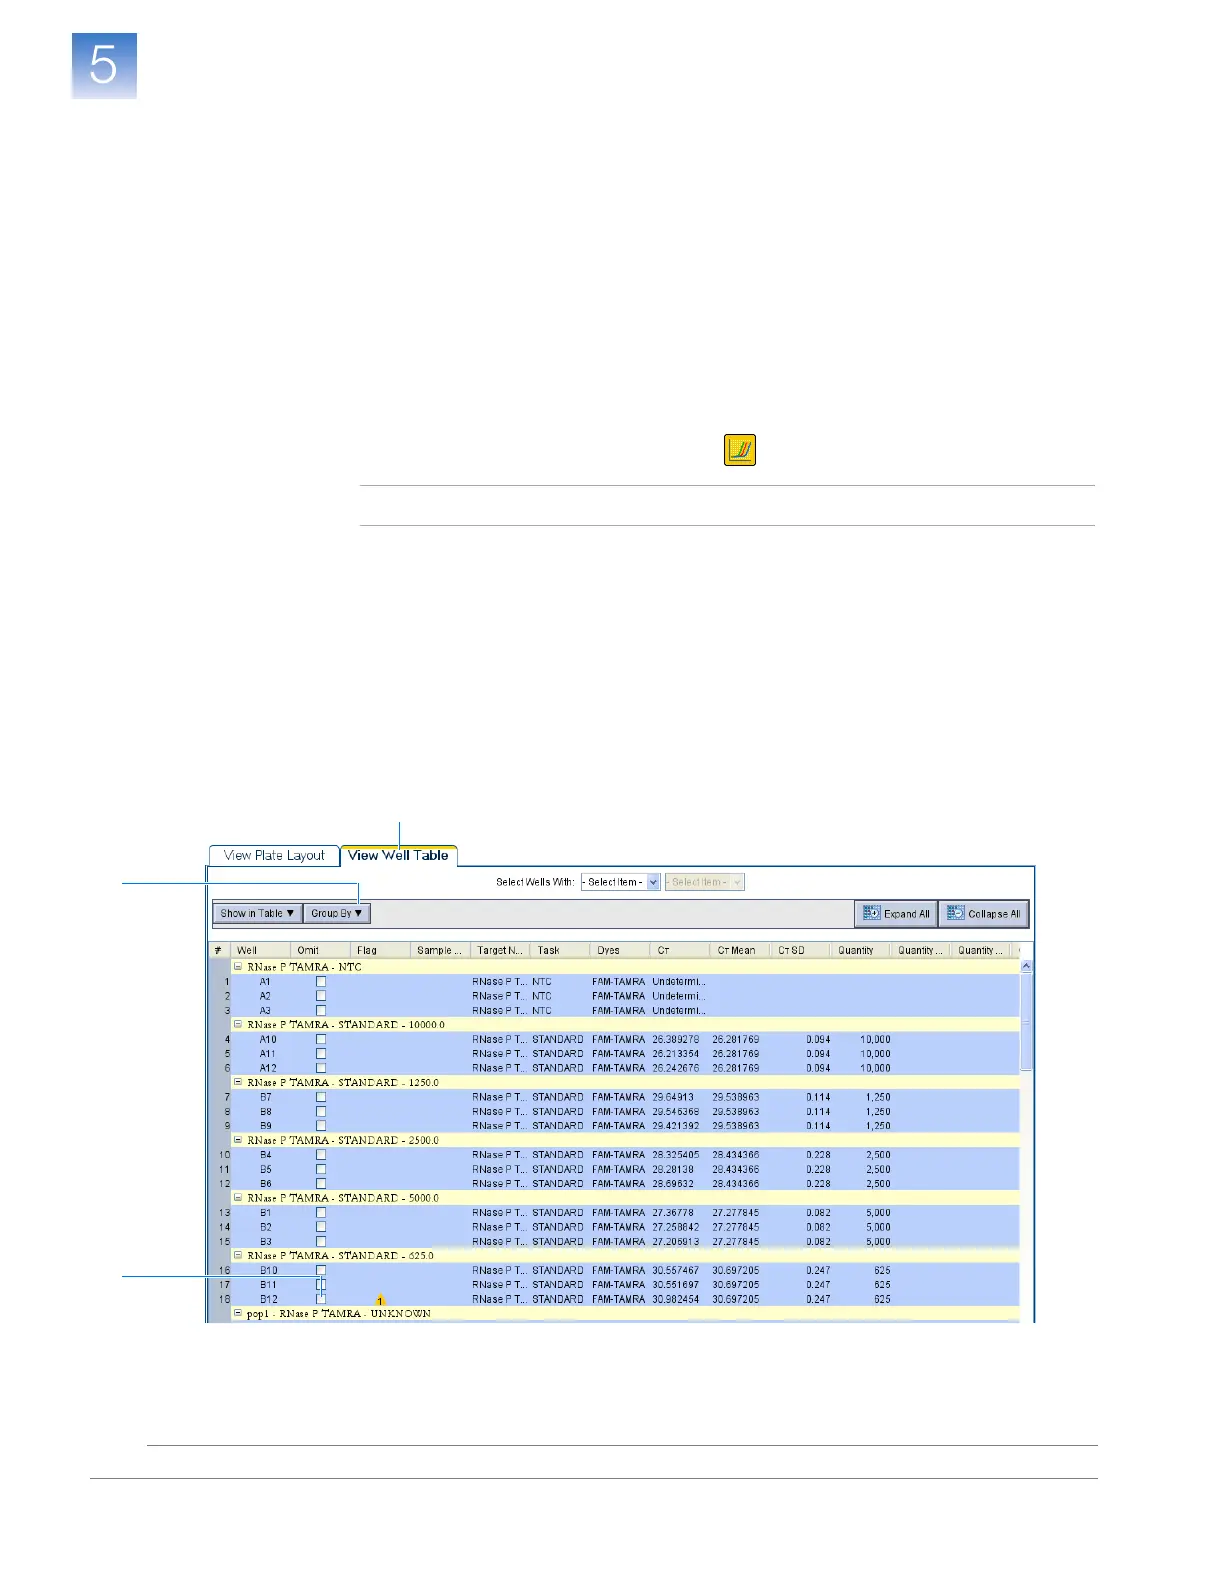
3. Select the View Well Table tab.
4. In the Well Table:
a. In the Group By drop-down list, select Replicate.
b. Look for any outliers in the replicate group (be sure they are flagged). In the
example experiment, the 7500 software flagged well B12 as a potential outlier.
5. Select the Omit check box next to well B12.
4a
3
5
 Loading...


