Chapter 5 Analyze the Experiment
View the Amplification Plot
Applied Biosystems 7500/7500 Fast Real-Time PCR System Getting Started Guide for Standard Curve
Experiments
74
Notes
View the Amplification Plot
The Amplification Plot screen displays amplification of all samples in the selected wells.
Three plots are available:
• ∆Rn vs Cycle – ∆Rn is the magnitude of normalized fluorescence generated by the
reporter at each cycle during the PCR amplification. This plot displays ∆Rn as a
function of cycle number. You can use this plot to identify and examine irregular
amplification and to view threshold and baseline values for the run.
• Rn vs Cycle – Rn is the fluorescence from the reporter dye normalized to the
fluorescence from the passive reference. This plot displays Rn as a function of cycle
number. You can use this plot to identify and examine irregular amplification.
• C
T
vs Well – C
T
is the PCR cycle number at which the fluorescence meets the
threshold in the amplification plot. This plot displays C
T
as a function of well
position. You can use this plot to locate outlying amplification (outliers).
Each plot can be displayed on a linear or log10 scale.
About the
Example
Experiment
In the standard curve example experiment, you review the target in the Amplification
Plot screen for:
• Correct baseline and threshold values
•Outliers
View the
Amplification Plot
1. In the navigation pane, select Analysis Amplification Plot.
Note: If no data are displayed, click Analyze.
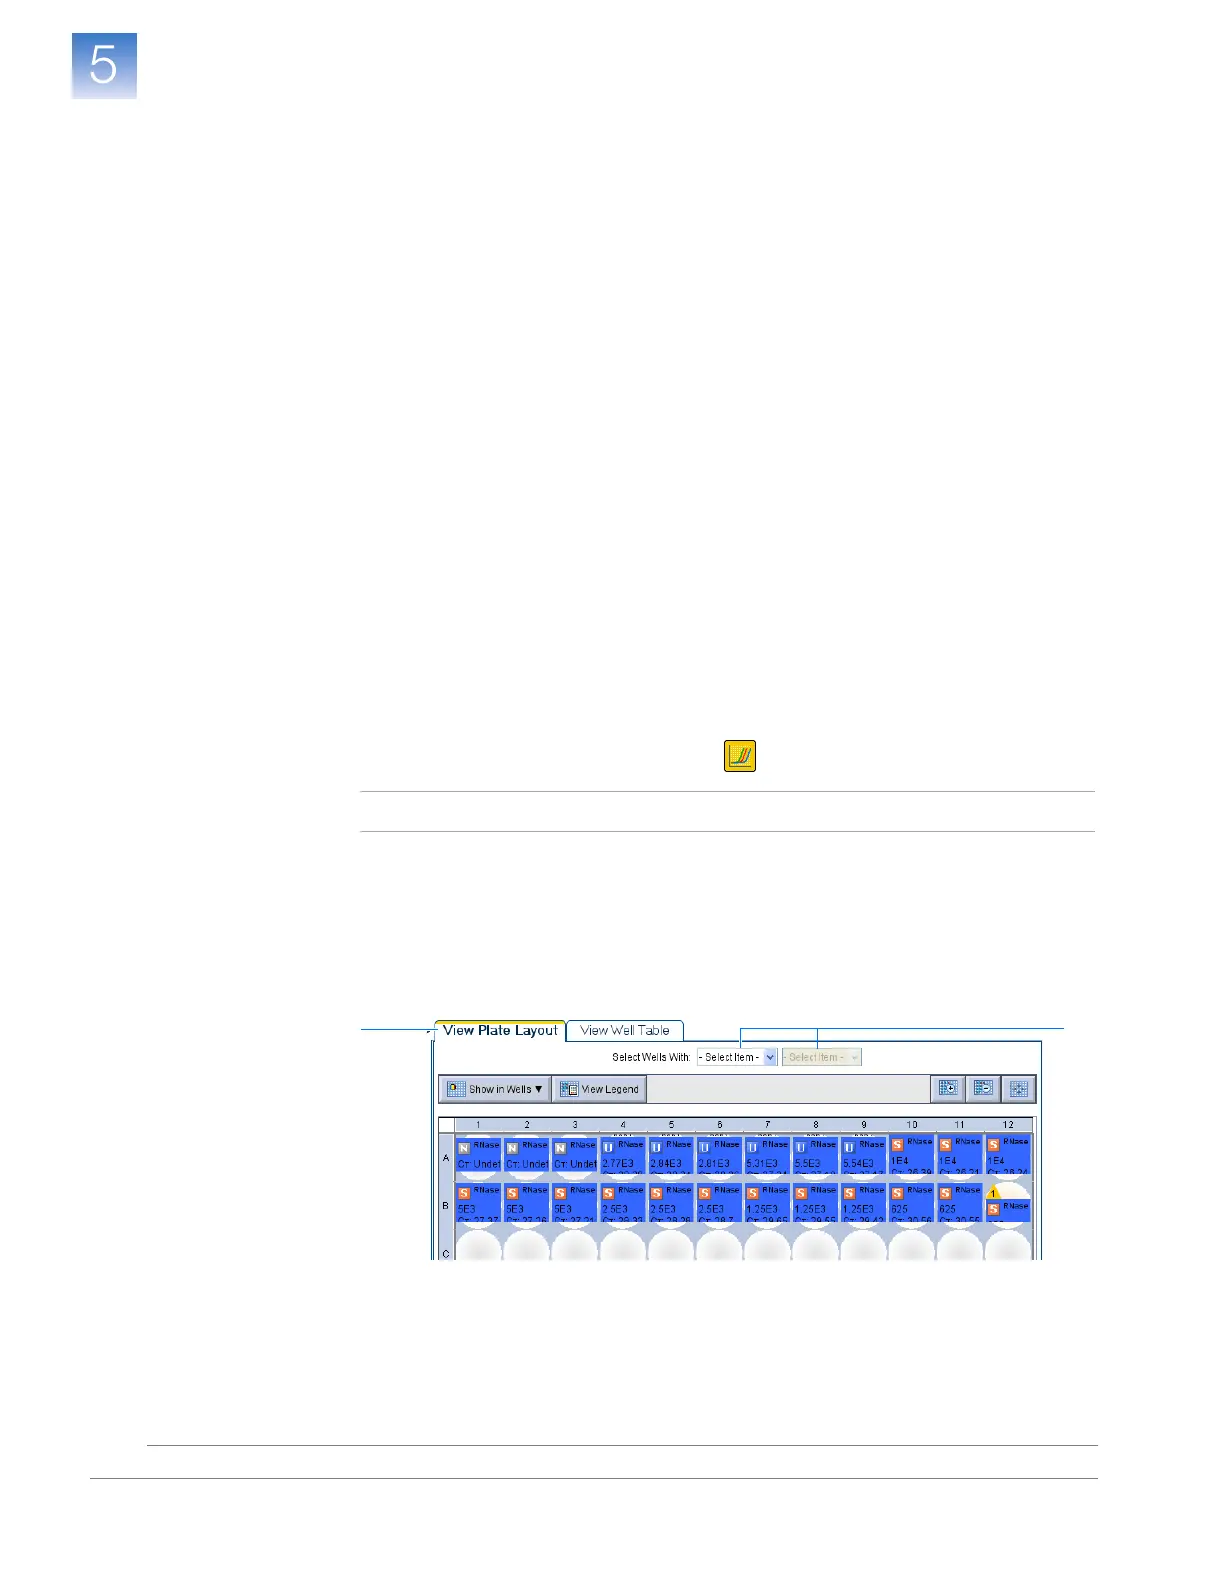
2. Display the RNase P wells in the Amplification Plot screen:
a. Select the View Plate Layout tab.
b. In the Select Wells With drop-down lists, select Ta rge t, then RNase P
TAMRA.
3. In the Amplification Plot screen:
a. In the Plot Type drop-down list, select ∆Rn vs Cycle (default).
b. In the Plot Color drop-down list, select Well (default).
2a
2b
 Loading...


