Chapter 5 Analyze the Experiment
View the Well Table
81
Applied Biosystems 7500/7500 Fast Real-Time PCR System Getting Started Guide for Standard Curve
Experiments
Notes
View the Well Table
The Well Table displays data for each well in the reaction plate, including:
• The sample name, target name, task, and dyes
• The calculated threshold cycle (C
T
), normalized fluorescence (Rn), and quantity
values
•Comments
•Flags
About the
Example
Experiment
In the standard curve example experiment, you review the Well Table for:
• Quantity values
•Flags
•C
T
values (including C
T
standard deviation)
View the Well
Tabl e
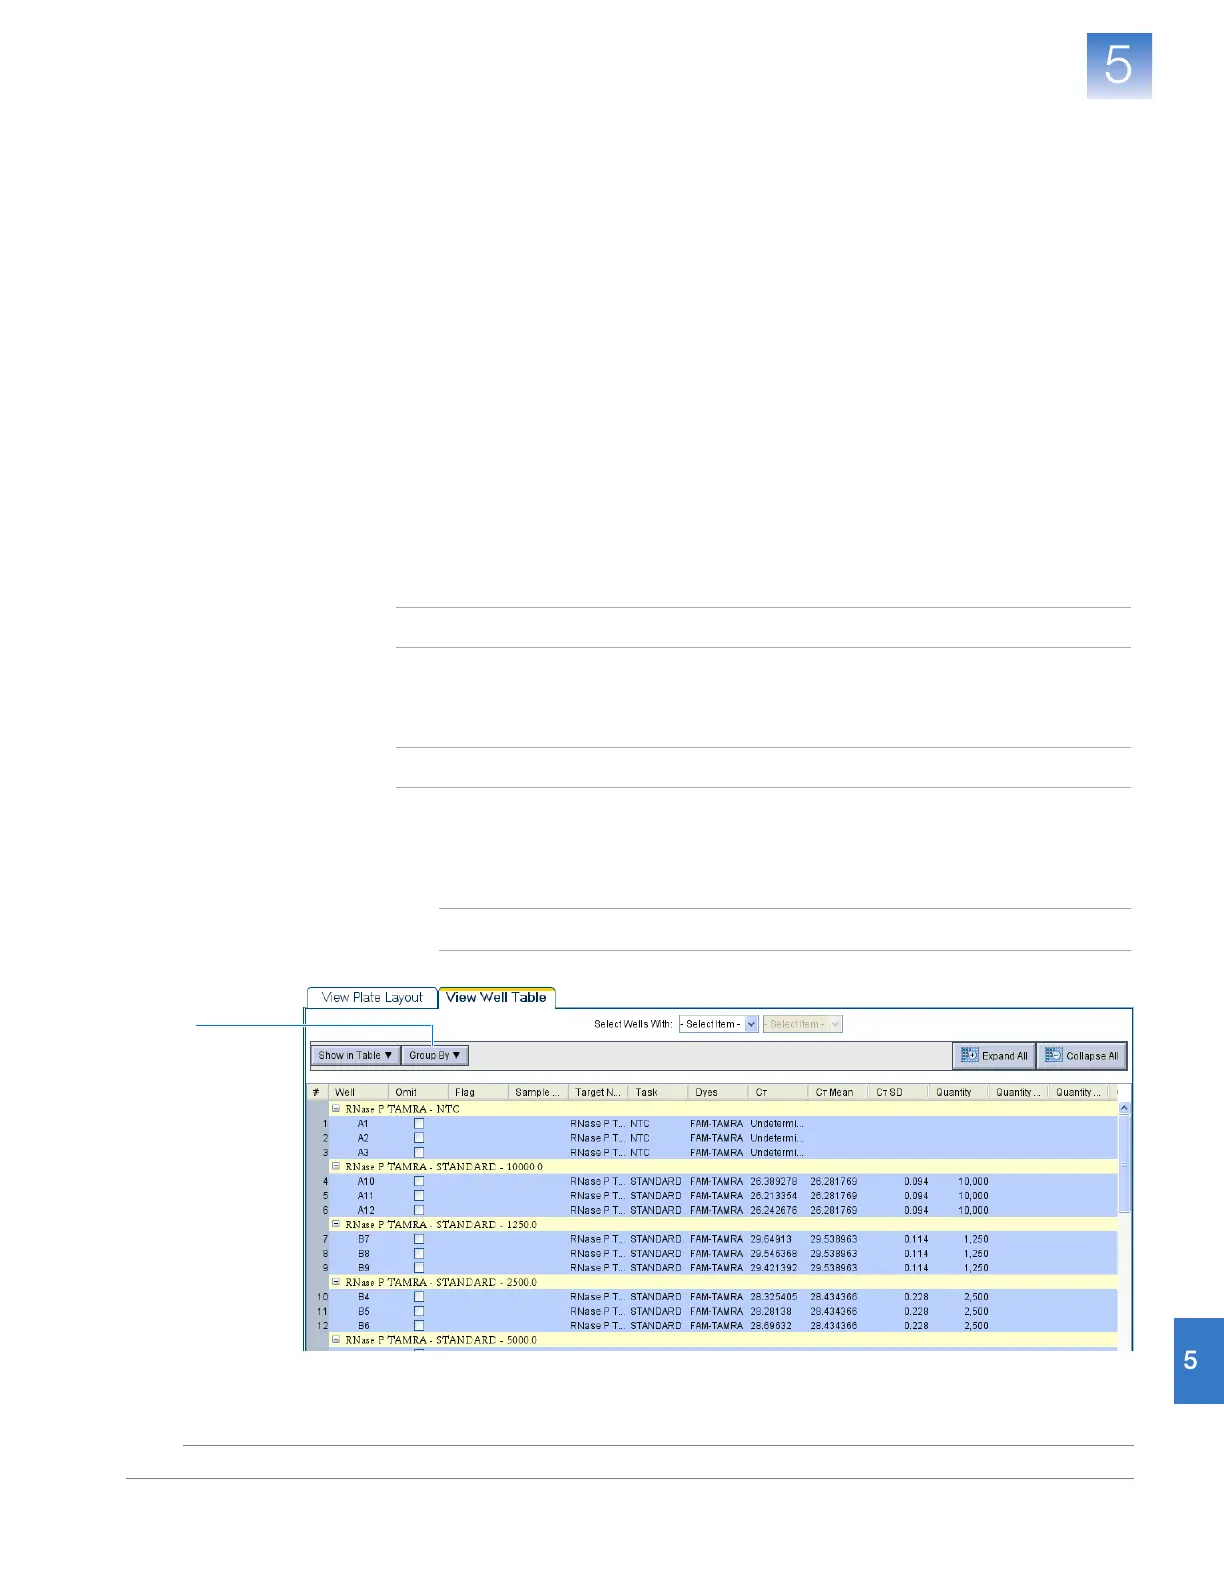
1. In the navigation pane, select Analysis, then select the View Well Table tab.
Note: If no data are displayed, click Analyze.
2. Use the Group By drop-down list to group wells by a specific category. For the
example experiment, group the wells by replicate, flag, or C
T
value.
Note: You can select only one category at a time.
a.
In the Group By drop-down list, select
Replicate
. The software groups the
replicate wells: negative controls, standards, and samples. In the example
experiment, note that the quantity values within each replicate group are similar.
Note: To move a column, drag the column heading.
2a
 Loading...


