Chapter 5 Analyze the Experiment
View the Well Table
Applied Biosystems 7500/7500 Fast Real-Time PCR System Getting Started Guide for Standard Curve
Experiments
82
Notes
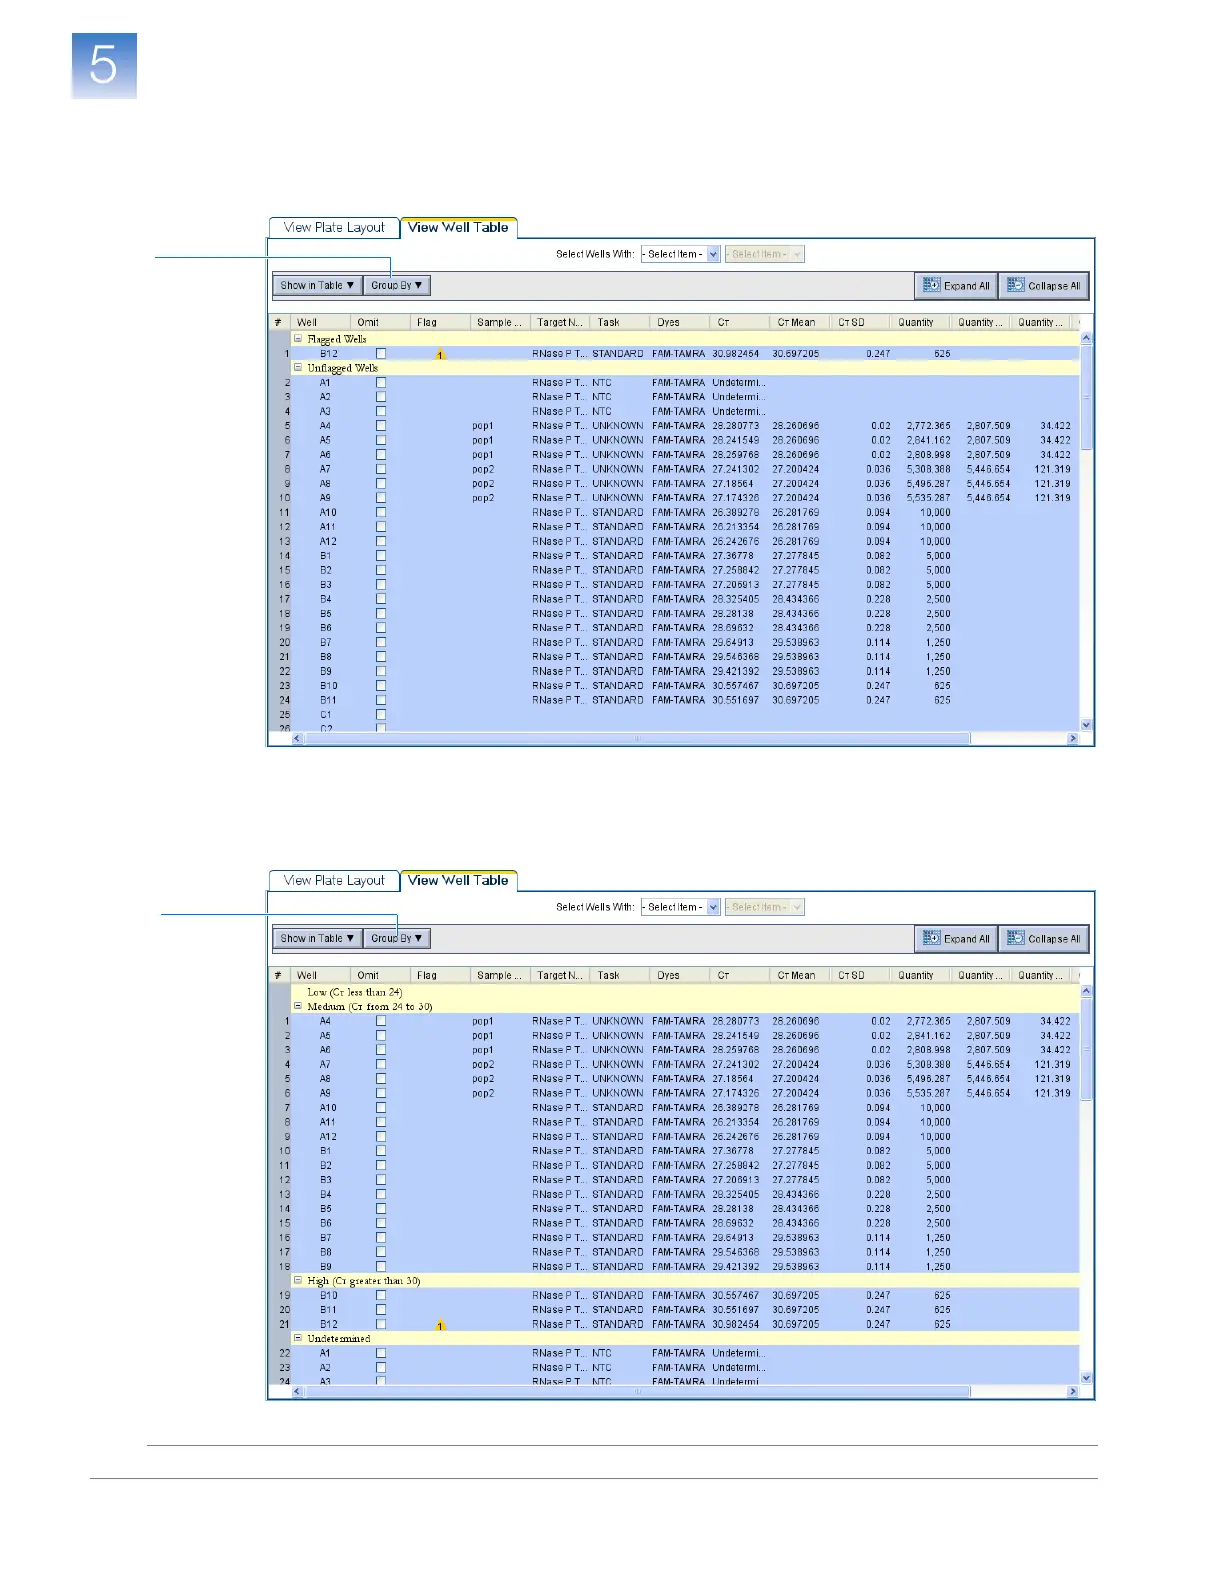
b.
In the Group By drop-down list, select
Flag
. The software groups the flagged
and unflagged wells. In the example experiment, well B12 is flagged.
c. In the Group By drop-down list, select C
T
. The software groups the wells by
C
T
value: low, medium, high, and undetermined. In the example experiment,
the C
T
values are within the expected range (>8 and <35).
2b
2c
 Loading...


