Chapter 5 Analyze the Experiment
View the Amplification Plot
75
Applied Biosystems 7500/7500 Fast Real-Time PCR System Getting Started Guide for Standard Curve
Experiments
Notes
c. Click (Show a legend for the plot).
Note: This is a toggle button. When the legend is displayed, the button
changes to Hide the plot legend.
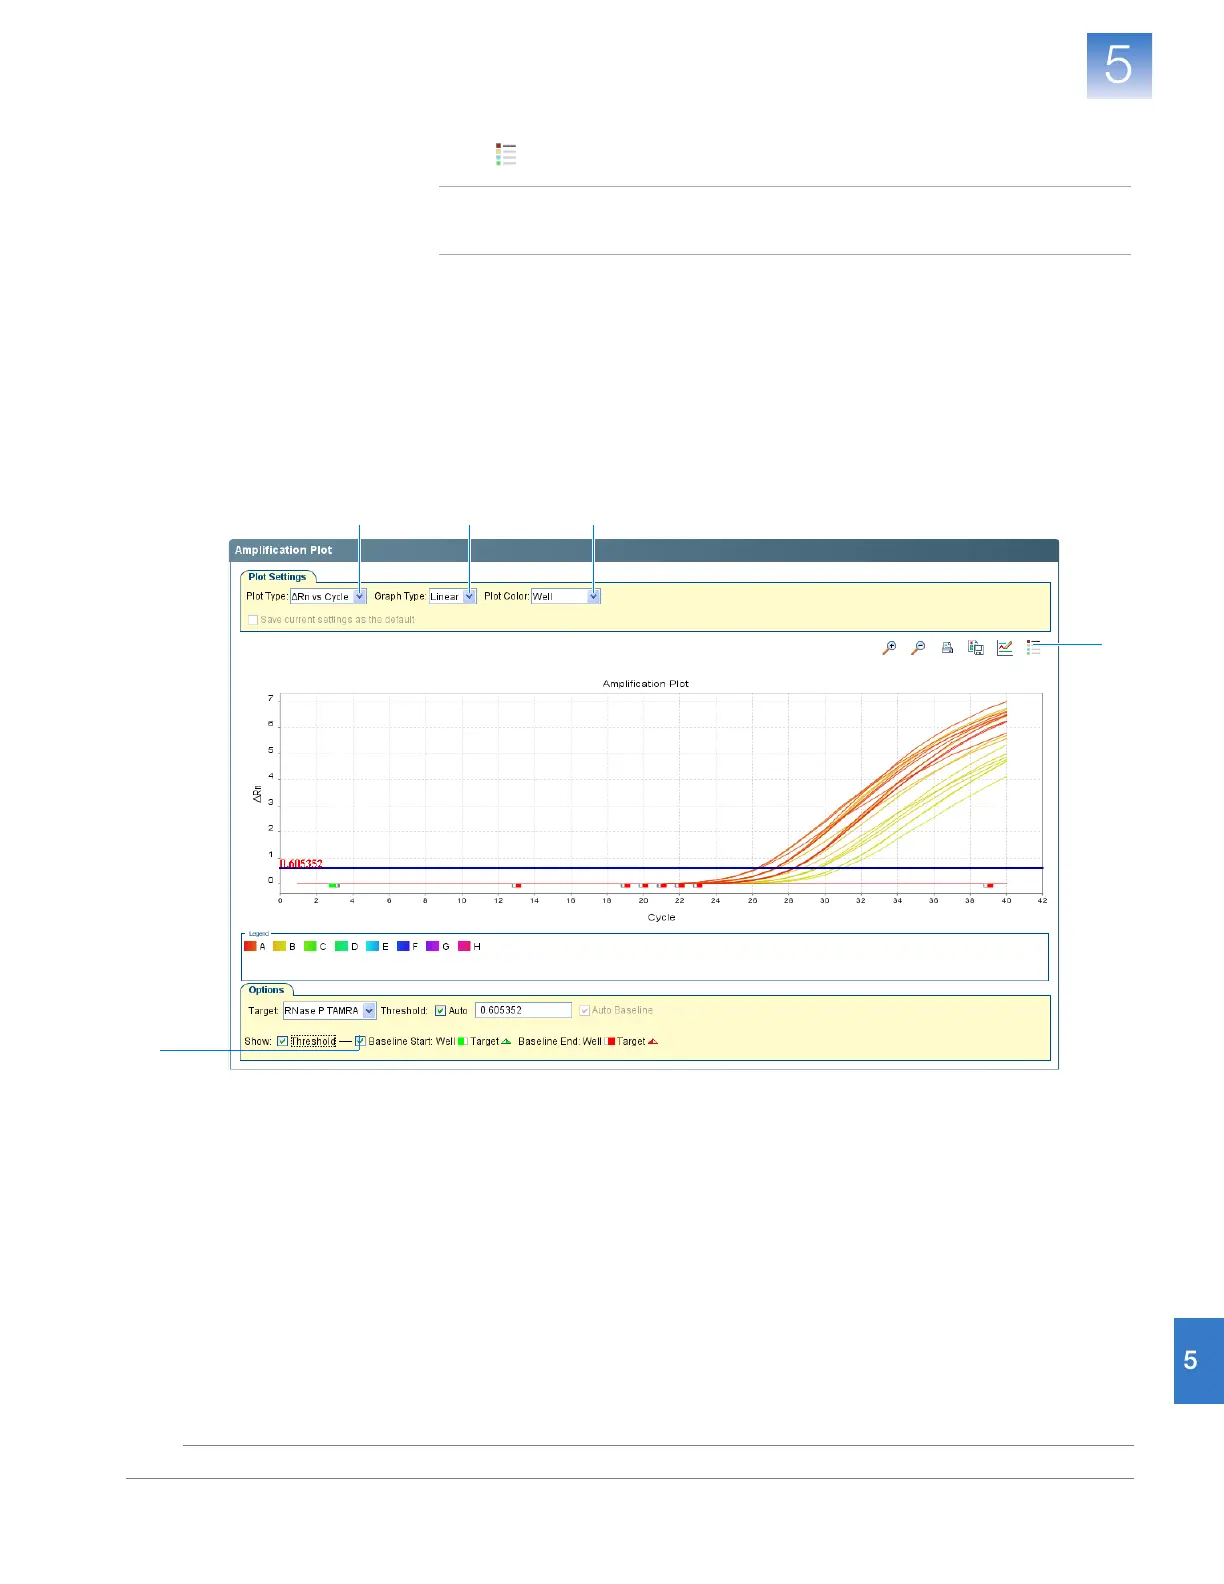
4. View the baseline values:
a. In the Graph Type drop-down list, select Linear.
b. Select the Baseline check box to show the start cycle and end cycle.
c. Verify that the baseline is set correctly: The end cycle should be set a few
cycles before the cycle number where significant fluorescence is detected. In
the example experiment, the baseline is set correctly.
4b
3c
3a 4a 3b
 Loading...


